Rational Functions
4. Graphing Rational Functions
Learning outcomes
- I can identify vertical asymptotes.
- I can identify horizontal and oblique asymptotes.
- I can determine intercepts.
- I can sketch rational function graphs.
- I can interpret asymptotic behaviour.
Introduction
Rational functions are used to describe mathematical relationships involving ratios, rates, inverse variation, and quantities that change in relation to one another.
Unlike many polynomial functions, rational functions can have graphs that are separated into different branches, approach certain lines without reaching them, or contain missing points called holes.
For example, consider:
f(x) = 1/x
As x approaches zero from the positive side, f(x) becomes increasingly large. As x approaches zero from the negative side, f(x) becomes increasingly negative. However, the function is never defined at x = 0.
This behaviour introduces one of the most important features of rational function graphs: asymptotes.
Understanding how to identify asymptotes, calculate intercepts, and analyze the behaviour of a function allows us to sketch rational graphs accurately without plotting hundreds of points.
In this lesson, we will investigate vertical, horizontal, and oblique asymptotes, calculate x- and y-intercepts, construct rational function graphs, and interpret their behaviour in mathematical and real-world situations.
Understanding the Shape of Rational Functions
A rational function has the general form:
f(x) = P(x)/Q(x)
where P(x) and Q(x) are polynomials and Q(x) is not the zero polynomial.
Consider the parent rational function:
f(x) = 1/x
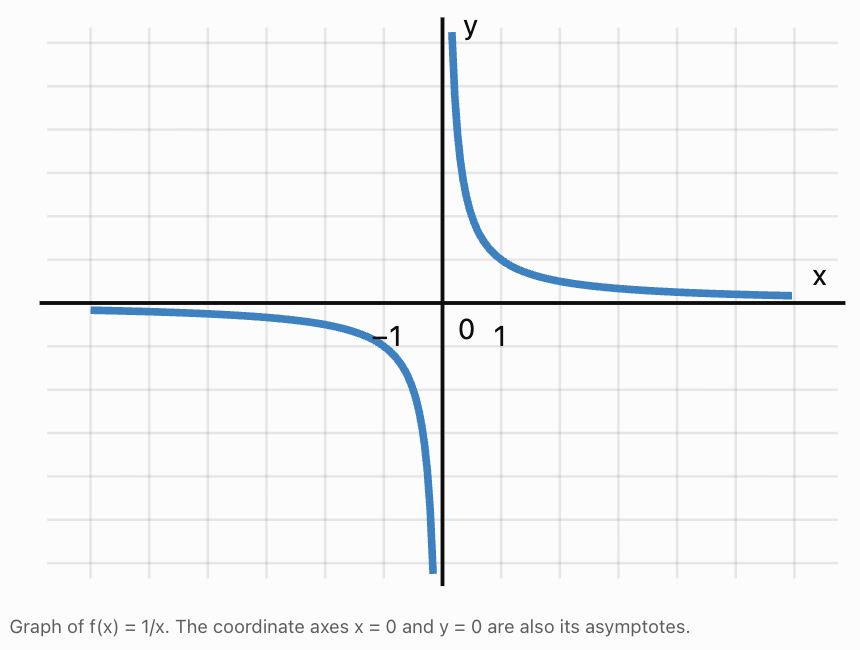
Important observations:
-
The graph has two separate branches.
-
The function is undefined at x = 0.
-
The graph approaches the y-axis without crossing it.
-
The graph approaches the x-axis as x becomes very large in magnitude.
-
The function is positive when x is positive and negative when x is negative.
These observations help us understand the behaviour of more complicated rational functions.
Vertical Asymptotes
A vertical asymptote is a vertical line x = a that a graph approaches as the function increases or decreases without bound near a particular input value.
For example:
f(x) = 1/(x − 3)
The denominator becomes zero when:
x − 3 = 0
x = 3
Therefore, the graph has a vertical asymptote at:
x = 3
As x approaches 3 from the right, f(x) approaches positive infinity.
As x approaches 3 from the left, f(x) approaches negative infinity.
Finding Vertical Asymptotes
-
Factor the numerator and denominator.
-
Identify and cancel any common factors, while recording the original restrictions.
-
Set the remaining denominator equal to zero.
-
Determine whether the function grows without bound near those values.
For a fully reduced rational function, real zeros of its denominator are vertical asymptotes.
Worked Example 1: Finding a Vertical Asymptote
Find the vertical asymptote of:
f(x) = (2x + 1)/(x − 4)
Step 1: Set the denominator equal to zero.
x − 4 = 0
Step 2: Solve.
x = 4
Step 3: Check the numerator.
At x = 4:
2(4) + 1 = 9
The numerator is not zero, so no factor cancels.
Answer: Vertical asymptote x = 4.
Worked Example 2: Multiple Vertical Asymptotes
Find the vertical asymptotes of:
f(x) = 3/(x² − 9)
Factor the denominator:
x² − 9 = (x − 3)(x + 3)
Set each factor equal to zero:
x − 3 = 0 → x = 3
x + 3 = 0 → x = −3
Neither factor cancels.
Answer: Vertical asymptotes x = −3 and x = 3.
Vertical Asymptotes Versus Holes
Not every zero of an original denominator produces a vertical asymptote.
Consider:
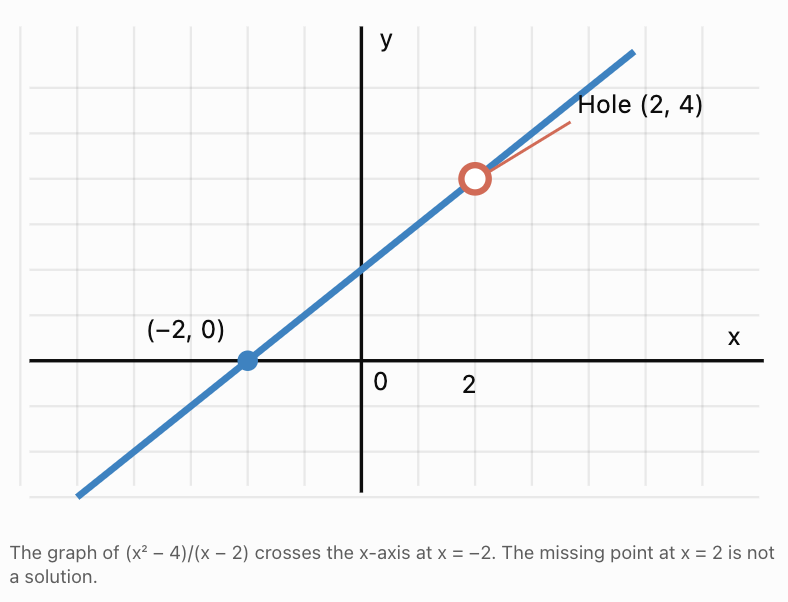
f(x) = (x² − 4)/(x − 2)
Factor:
f(x) = (x − 2)(x + 2)/(x − 2)
Simplify:
f(x) = x + 2, where x ≠ 2.
The graph is the line y = x + 2 with a missing point at (2, 4).
This is a hole, not a vertical asymptote.
Horizontal Asymptotes
A horizontal asymptote is a horizontal line y = L that a function approaches as x increases or decreases without bound.
Horizontal asymptotes describe the end behaviour of a function.
For rational functions, horizontal asymptotes can often be found by comparing the degrees of the numerator and denominator.
The degree of a polynomial is its highest power of x.
Rules for Horizontal Asymptotes
Let:
f(x) = P(x)/Q(x)
|
Degrees |
Horizontal asymptote |
|---|---|
|
Degree of numerator less than denominator |
y = 0 |
|
Degrees equal |
y = ratio of leading coefficients |
|
Degree of numerator greater than denominator |
No horizontal asymptote |
The leading coefficient is the coefficient of the highest-degree term.
Worked Example 3: Numerator Degree Smaller
Find the horizontal asymptote of:
f(x) = (3x + 2)/(x² + 1)
Numerator degree = 1.
Denominator degree = 2.
Since 1 is less than 2:
Horizontal asymptote: y = 0.
As x becomes very large in either direction, the denominator grows faster than the numerator, causing the fraction to approach zero.
Worked Example 4: Equal Degrees
Find the horizontal asymptote of:
f(x) = (4x² + 3x − 1)/(2x² + 5)
Both polynomials have degree 2.
Compare their leading coefficients:
4/2 = 2
Horizontal asymptote: y = 2.
Worked Example 5: Numerator Degree Greater
Find the horizontal asymptote of:
f(x) = (x² + 1)/(x − 2)
Numerator degree = 2.
Denominator degree = 1.
The numerator degree is greater.
Therefore, there is no horizontal asymptote.
However, because the degree difference is exactly 1, the function has an oblique asymptote.
Can a Graph Cross a Horizontal Asymptote?
Yes.
A horizontal asymptote describes what happens as x approaches positive or negative infinity. It does not necessarily prevent the graph from crossing the line.
For example:
f(x) = (x + 1)/(x² + 1)
has horizontal asymptote y = 0.
The function crosses y = 0 when x = −1.
Therefore, horizontal asymptotes are not barriers that a graph can never cross.
Oblique Asymptotes
An oblique asymptote, also called a slant asymptote, is a nonhorizontal straight line that a rational function approaches as x becomes very large in magnitude.
An oblique asymptote occurs when the degree of the numerator is exactly one greater than the degree of the denominator, after simplification.
To find it, divide the numerator by the denominator using polynomial division.
Worked Example 6: Finding an Oblique Asymptote
Find the oblique asymptote of:
f(x) = (x² + 3x + 1)/(x + 1)
Step 1: Divide x² + 3x + 1 by x + 1.
First term:
x² ÷ x = x
Multiply:
x(x + 1) = x² + x
Subtract:
(x² + 3x + 1) − (x² + x) = 2x + 1
Next term:
2x ÷ x = 2
Multiply:
2(x + 1) = 2x + 2
Subtract:
(2x + 1) − (2x + 2) = −1
Step 2: Rewrite the function.
f(x) = x + 2 − 1/(x + 1)
Step 3: Analyze end behaviour.
As x approaches positive or negative infinity:
−1/(x + 1) approaches zero.
Therefore:
Oblique asymptote: y = x + 2.
The vertical asymptote is x = −1.
Worked Example 7: Another Oblique Asymptote
Find the oblique asymptote of:
f(x) = (2x² − x + 5)/(x − 2)
Polynomial division gives:
2x² − x + 5 = (x − 2)(2x + 3) + 11
Therefore:
f(x) = 2x + 3 + 11/(x − 2)
As x becomes very large in magnitude, the remainder term approaches zero.
Oblique asymptote: y = 2x + 3.
What About Larger Degree Differences?
If the numerator degree exceeds the denominator degree by 2 or more, polynomial division may produce a quadratic or higher-degree polynomial asymptote rather than a straight oblique asymptote.
For example:
f(x) = (x³ + 1)/x
Simplify:
f(x) = x² + 1/x
As |x| becomes very large, 1/x approaches zero.
Therefore, the graph approaches the parabola:
y = x²
This is a polynomial asymptote, not an oblique line.
Finding Intercepts
Intercepts help us locate where a rational function crosses the coordinate axes.
Finding x-Intercepts
An x-intercept occurs where:
f(x) = 0
For a rational function, a fraction equals zero when its numerator equals zero and its denominator is nonzero.
Therefore:
-
Set the numerator equal to zero.
-
Solve for x.
-
Check that each solution is in the original domain.
Worked Example 8: Finding x-Intercepts
Find the x-intercepts of:
f(x) = (x² − 9)/(x + 1)
Set the numerator equal to zero:
x² − 9 = 0
Factor:
(x − 3)(x + 3) = 0
Solve:
x = 3 or x = −3
The denominator is zero only at x = −1, so both solutions are valid.
x-intercepts: (−3, 0) and (3, 0).
Finding the y-Intercept
A y-intercept occurs when x = 0.
Substitute x = 0 into the function, provided zero belongs to its domain.
Worked Example 9: Finding the y-Intercept
For:
f(x) = (x² − 9)/(x + 1)
Substitute x = 0:
f(0) = (0 − 9)/(0 + 1)
f(0) = −9
y-intercept: (0, −9).
When an Intercept Does Not Exist
Consider:
f(x) = 1/x
There is no x-intercept because the numerator never equals zero.
There is no y-intercept because x = 0 is excluded from the domain.
A rational function may have multiple intercepts, one intercept, or none.
A Complete Method for Sketching Rational Functions
A systematic approach makes graphing much easier.
-
Factor the function. Identify any common factors.
-
Determine the domain. Record all values that make the original denominator zero.
-
Identify holes. Locate cancelled factors and calculate their missing coordinates.
-
Find vertical asymptotes. Solve the remaining denominator equal to zero.
-
Find horizontal or oblique asymptotes. Compare polynomial degrees and use division if necessary.
-
Calculate intercepts. Find valid x-intercepts and the y-intercept.
-
Test values in different intervals. Determine where branches lie and how they behave.
-
Sketch the graph. Draw smooth curves consistent with the asymptotes, intercepts, holes, and end behaviour.
Worked Example 10: Sketching a Rational Function with Two Asymptotes
Sketch:
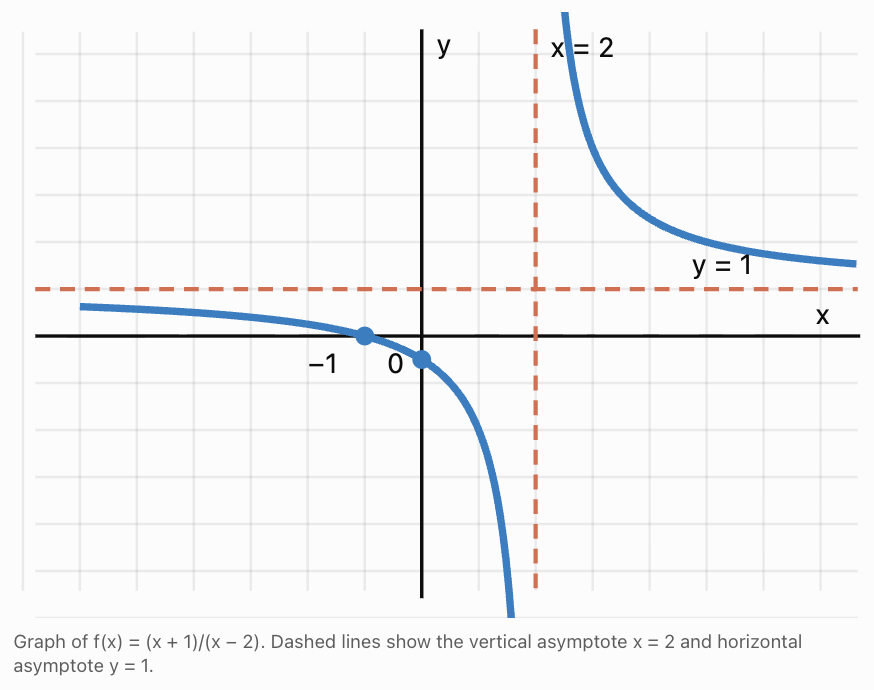
f(x) = (x + 1)/(x − 2)
Step 1: Determine the domain.
x − 2 = 0
x = 2
Domain: x ≠ 2.
Step 2: Find the vertical asymptote.
x = 2.
Step 3: Find the horizontal asymptote.
Both polynomials have degree 1.
The ratio of leading coefficients is 1/1.
Horizontal asymptote: y = 1.
Step 4: Find the x-intercept.
x + 1 = 0
x = −1
x-intercept: (−1, 0).
Step 5: Find the y-intercept.
f(0) = 1/(−2) = −1/2
y-intercept: (0, −0.5).
Step 6: Rewrite the function.
f(x) = 1 + 3/(x − 2)
This reveals the graph's behaviour.
When x approaches 2 from the left, the function approaches negative infinity.
When x approaches 2 from the right, the function approaches positive infinity.
As x approaches either positive or negative infinity, the function approaches y = 1.
Worked Example 11: Sketching a Function with Two Vertical Asymptotes
Sketch:
f(x) = 1/(x² − 4)
Step 1: Factor the denominator.
x² − 4 = (x − 2)(x + 2)
Step 2: Find vertical asymptotes.
x = −2 and x = 2.
Step 3: Find the horizontal asymptote.
Numerator degree = 0.
Denominator degree = 2.
Horizontal asymptote: y = 0.
Step 4: Find intercepts.
The numerator is 1, so there are no x-intercepts.
For the y-intercept:
f(0) = 1/(−4) = −1/4
y-intercept: (0, −0.25).
Step 5: Determine signs.
|
Interval |
Sign of f(x) |
|---|---|
|
x less than −2 |
Positive |
|
−2 less than x less than 2 |
Negative |
|
x greater than 2 |
Positive |
Step 6: Interpret the graph.
The graph has three branches.
The middle branch lies below the x-axis and approaches negative infinity near both vertical asymptotes.
The outer branches lie above the x-axis, approach positive infinity near their respective vertical asymptotes, and approach zero as x moves far away.
Worked Example 12: Sketching a Function with an Oblique Asymptote
Sketch:
f(x) = (x² + 1)/(x − 1)
Step 1: Find the vertical asymptote.
x − 1 = 0
x = 1.
Step 2: Find the oblique asymptote.
Divide x² + 1 by x − 1:
f(x) = x + 1 + 2/(x − 1)
Therefore:
Oblique asymptote: y = x + 1.
Step 3: Find the x-intercepts.
x² + 1 = 0
There are no real solutions.
Therefore, there are no x-intercepts.
Step 4: Find the y-intercept.
f(0) = 1/(−1) = −1
y-intercept: (0, −1).
Step 5: Interpret the behaviour.
As x approaches 1 from the left, f(x) approaches negative infinity.
As x approaches 1 from the right, f(x) approaches positive infinity.
For large positive x, the graph approaches y = x + 1 from above.
For large negative x, it approaches the line from below.
The graph has two branches separated by x = 1.
Interpreting Asymptotic Behaviour
Asymptotes help us describe what happens near critical input values and at the extremes of the graph.
Behaviour Near Vertical Asymptotes
Consider:
f(x) = 1/(x − 2)
|
x |
f(x) |
|---|---|
|
1.9 |
−10 |
|
1.99 |
−100 |
|
1.999 |
−1000 |
|
2.001 |
1000 |
|
2.01 |
100 |
|
2.1 |
10 |
As x approaches 2 from the left, f(x) decreases without bound.
As x approaches 2 from the right, f(x) increases without bound.
Using limit notation:
The minus and plus signs on the approach indicate the left and right sides.
Behaviour Near Horizontal Asymptotes
Consider:
f(x) = (2x + 3)/(x + 1)
Rewrite:
f(x) = 2 + 1/(x + 1)
As x approaches positive infinity, 1/(x + 1) approaches zero.
As x approaches negative infinity, the same term also approaches zero.
Therefore:
The horizontal asymptote is y = 2.
Behaviour Near Oblique Asymptotes
Consider:
f(x) = x + 3 + 5/(x − 2)
As x becomes very large in magnitude:
5/(x − 2) approaches zero.
Therefore, the difference between f(x) and the line y = x + 3 approaches zero.
This is the defining behaviour of an oblique asymptote.
Real-World Applications of Rational Function Graphs
Rational functions are useful for modelling situations where one quantity depends on the ratio of two changing quantities.
Application 1: Average Production Cost
Suppose a factory has a fixed cost of $1,200 and a variable production cost of $15 per item.
The total cost of producing x items is:
C(x) = 1200 + 15x
The average cost per item is:
A(x) = (1200 + 15x)/x
Simplify:
A(x) = 1200/x + 15
The mathematical function has a vertical asymptote at x = 0 and a horizontal asymptote at y = 15.
In the real-world situation, x must be a positive whole number.
|
Items produced |
Average cost |
|---|---|
|
20 |
$75 |
|
50 |
$39 |
|
100 |
$27 |
|
200 |
$21 |
|
400 |
$18 |
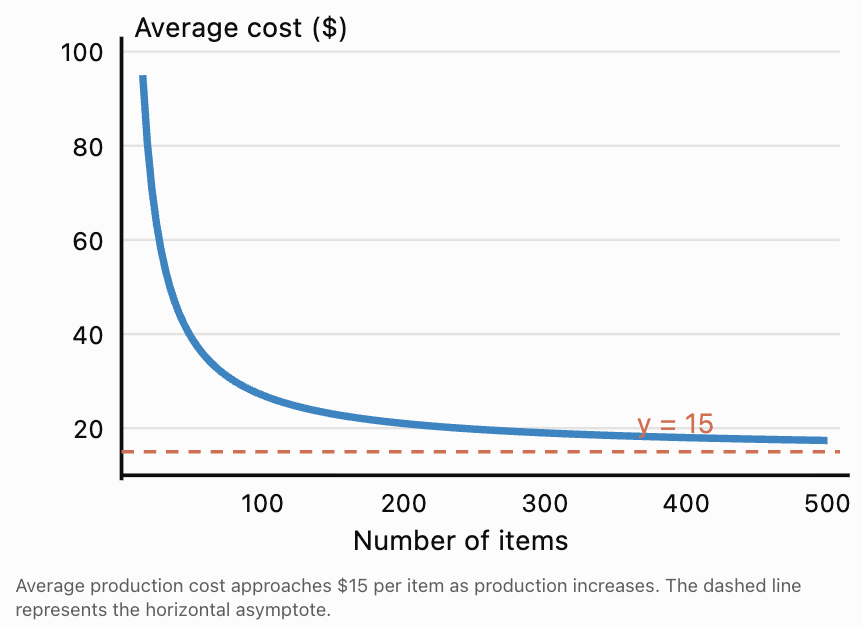
Interpretation: As more items are produced, the fixed cost is spread across more units. The average cost decreases toward $15 but remains above $15 for every finite positive production quantity.
Application 2: Travel Time and Speed
The time needed to travel a fixed distance is:
Time = Distance / Speed
For a journey of 180 km:
t(v) = 180/v
where v is speed in km/h.
The mathematical graph has asymptotes at v = 0 and t = 0.
In the physical model, only positive speeds are meaningful.
As speed increases, travel time decreases toward zero, but it cannot equal zero for a finite positive speed.
Application 3: Concentration and Dilution
Suppose 50 grams of a dissolved substance are contained in a solution with a volume of V litres.
The concentration is:
C(V) = 50/V
The function has:
-
A vertical asymptote at V = 0.
-
A horizontal asymptote at C = 0.
As the volume increases, concentration decreases.
This relationship helps explain dilution in chemistry, although the model assumes the amount of dissolved substance remains constant.
Application 4: Electrical Resistance
For a constant voltage of 24 V, Ohm's law gives:
I(R) = 24/R
where I is current and R is resistance.
For positive resistance, increasing resistance decreases the current.
The graph approaches the horizontal asymptote I = 0 as resistance becomes very large.
This helps describe how electrical current responds to changes in resistance.
Common Mistakes
Mistake 1: Treating Every Denominator Zero as a Vertical Asymptote
Incorrect: The function (x² − 9)/(x − 3) has a vertical asymptote at x = 3.
Correct: Factoring and cancelling gives x + 3, where x ≠ 3. The graph has a hole at (3, 6), not a vertical asymptote.
Mistake 2: Comparing the Wrong Polynomial Degrees
For f(x) = (3x² + 1)/(2x² − 5), both degrees are 2.
The horizontal asymptote is y = 3/2, not y = 0.
Mistake 3: Assuming a Graph Cannot Cross a Horizontal Asymptote
A graph can cross a horizontal asymptote. The asymptote describes end behaviour rather than a forbidden boundary.
Mistake 4: Finding x-Intercepts Without Checking the Domain
A zero of the numerator is not a valid x-intercept if the original denominator is also zero at that value.
Always check for cancelled factors and excluded values.
Mistake 5: Confusing Vertical and Horizontal Asymptotes
Vertical asymptotes are equations of the form x = a.
Horizontal asymptotes are equations of the form y = b.
Mistake 6: Drawing Branches on the Wrong Side of an Asymptote
Knowing where an asymptote is located does not tell us whether the graph approaches positive or negative infinity.
Use sign analysis or test values on either side of the asymptote.
Mistake 7: Assuming Every Rational Function Has a Horizontal Asymptote
A rational function may have a horizontal, oblique, or higher-degree polynomial asymptote, depending on the degrees of its polynomials.
Key Terms
-
Rational Function: A function expressed as the quotient of two polynomials.
-
Domain: The set of permitted input values.
-
Excluded Value: An input that makes the original denominator zero.
-
Vertical Asymptote: A vertical line approached by a graph as its function values increase or decrease without bound.
-
Horizontal Asymptote: A horizontal line approached by a graph as x tends toward positive or negative infinity.
-
Oblique Asymptote: A nonhorizontal straight line approached by a graph as x becomes very large in magnitude.
-
Polynomial Asymptote: A polynomial curve or line approached by a function at infinity.
-
Degree: The highest exponent of a variable in a polynomial.
-
Leading Coefficient: The coefficient of the highest-degree term.
-
x-Intercept: A point where the graph crosses or touches the x-axis.
-
y-Intercept: A point where the graph crosses the y-axis.
-
Hole: A missing point caused by a removable discontinuity.
-
End Behaviour: The behaviour of a function as x approaches positive or negative infinity.
-
One-Sided Limit: The value or behaviour approached by a function from one side of an input.
-
Polynomial Division: A method for dividing one polynomial by another.
Key Takeaways
-
Rational function graphs can have multiple branches, holes, and asymptotes.
-
Vertical asymptotes are found from the zeros of the denominator after cancelling common factors.
-
A cancelled denominator factor may create a hole instead of a vertical asymptote.
-
Horizontal asymptotes are determined by comparing the degrees of the numerator and denominator.
-
When the numerator degree is smaller, the horizontal asymptote is y = 0.
-
When the degrees are equal, the horizontal asymptote is the ratio of leading coefficients.
-
When the numerator degree is exactly one greater, polynomial division gives an oblique asymptote.
-
x-intercepts occur at valid zeros of the numerator; y-intercepts are found by substituting x = 0.
-
Accurate graph sketches require asymptotes, intercepts, holes, sign analysis, and end behaviour.
-
Asymptotes help interpret long-term trends and extreme behaviour in real-world models.
Check Your Understanding
Question 1: Vertical Asymptotes
Find the vertical asymptotes of:
f(x) = 5/(x² − 16)
Question 2: Horizontal Asymptotes
Find the horizontal asymptote of:
f(x) = (6x² + 3x − 1)/(2x² + 7)
Question 3: Oblique Asymptotes
Find the oblique asymptote of:
f(x) = (x² + 4x + 2)/(x + 1)
Question 4: Intercepts
Find the x- and y-intercepts of:
f(x) = (x − 4)/(x + 2)
Question 5: Holes and Asymptotes
Analyze:
f(x) = (x² − 9)/(x − 3)
Determine whether the graph has a hole or vertical asymptote and identify its coordinates or equation.
Question 6: Complete Graph Analysis
For:
f(x) = (2x + 4)/(x − 1)
Find:
a) The domain.
b) The vertical asymptote.
c) The horizontal asymptote.
d) The x-intercept.
e) The y-intercept.
f) The behaviour near the vertical asymptote.
Question 7: Multiple Vertical Asymptotes
For:
f(x) = x/(x² − 4)
Determine the vertical and horizontal asymptotes, all intercepts, and the sign of the function on each interval separated by its vertical asymptotes.
Question 8: Real-World Interpretation
A business models its average cost per item using:
A(x) = 500/x + 20
where x is the number of items produced.
a) Identify the mathematical vertical asymptote.
b) Identify the horizontal asymptote.
c) Calculate the average cost for 50 items.
d) Explain the practical meaning of the horizontal asymptote.
Fully Worked Answers
Answer 1: Vertical Asymptotes
Given:
f(x) = 5/(x² − 16)
Set the denominator equal to zero:
x² − 16 = 0
Factor:
(x − 4)(x + 4) = 0
Solve:
x = 4 or x = −4
Neither factor cancels.
Answer: x = −4 and x = 4.
Answer 2: Horizontal Asymptote
Given:
f(x) = (6x² + 3x − 1)/(2x² + 7)
Both polynomials have degree 2.
The ratio of leading coefficients is:
6/2 = 3
Answer: y = 3.
Answer 3: Oblique Asymptote
Given:
f(x) = (x² + 4x + 2)/(x + 1)
Divide x² + 4x + 2 by x + 1.
First:
x² ÷ x = x
Subtract x² + x from the numerator:
3x + 2
Next:
3x ÷ x = 3
Subtract 3x + 3:
Remainder = −1
Therefore:
f(x) = x + 3 − 1/(x + 1)
As |x| becomes large, the remainder term approaches zero.
Answer: y = x + 3.
Answer 4: Intercepts
Given:
f(x) = (x − 4)/(x + 2)
x-intercept:
Set numerator equal to zero:
x − 4 = 0
x = 4
Therefore, (4, 0).
y-intercept:
Substitute x = 0:
f(0) = −4/2 = −2
Therefore, (0, −2).
Answer: x-intercept (4, 0); y-intercept (0, −2).
Answer 5: Hole or Asymptote
Given:
f(x) = (x² − 9)/(x − 3)
Factor:
f(x) = (x − 3)(x + 3)/(x − 3)
Simplify:
f(x) = x + 3, where x ≠ 3.
The graph follows y = x + 3 but is missing the point where x = 3.
At x = 3, the corresponding line value is:
y = 3 + 3 = 6
Answer: Hole at (3, 6). There is no vertical asymptote.
Answer 6: Complete Graph Analysis
Given:
f(x) = (2x + 4)/(x − 1)
a) Domain
x − 1 ≠ 0
x ≠ 1.
b) Vertical asymptote
x = 1.
c) Horizontal asymptote
Both polynomials have degree 1.
Leading coefficient ratio:
2/1 = 2
Therefore, y = 2.
d) x-intercept
2x + 4 = 0
2x = −4
x = −2
x-intercept: (−2, 0).
e) y-intercept
f(0) = 4/(−1) = −4
y-intercept: (0, −4).
f) Behaviour near the vertical asymptote
Rewrite:
f(x) = 2 + 6/(x − 1)
As x approaches 1 from the left, f(x) approaches negative infinity.
As x approaches 1 from the right, f(x) approaches positive infinity.
Answer 7: Multiple Asymptotes
Given:
f(x) = x/(x² − 4)
Factor the denominator:
x² − 4 = (x − 2)(x + 2)
Vertical asymptotes:
x = −2 and x = 2.
Horizontal asymptote:
Numerator degree = 1.
Denominator degree = 2.
Therefore, y = 0.
Intercepts:
Set the numerator equal to zero:
x = 0
The denominator at x = 0 is −4, so the point is valid.
Both the x-intercept and y-intercept are (0, 0).
Sign analysis:
|
Interval |
Sign |
|---|---|
|
x less than −2 |
Negative |
|
−2 less than x less than 0 |
Positive |
|
0 less than x less than 2 |
Negative |
|
x greater than 2 |
Positive |
These signs help determine the positions of the graph's branches.
Answer 8: Real-World Interpretation
Given:
A(x) = 500/x + 20
a) Vertical asymptote
x = 0.
b) Horizontal asymptote
As x becomes very large, 500/x approaches zero.
Therefore, y = 20.
c) Average cost for 50 items
A(50) = 500/50 + 20
= 10 + 20
= $30 per item.
d) Interpretation
As production increases, the fixed cost is distributed across more items.
The average cost approaches $20 per item, representing the variable production cost per unit in this model.
The average cost remains above $20 for every finite positive production quantity.
This completes Graphing Rational Functions, including vertical, horizontal, and oblique asymptotes, intercepts, graph sketching, and interpretation of asymptotic behaviour.