Analyzing and Interpreting Graphs
3. Maximums and Minimums
Learning outcomes
- I can identify maximum values.
- I can identify minimum values.
- I can locate turning points.
- I can interpret extrema in context.
- I can compare maximums and minimums across functions.
Introduction
Many real-world situations involve finding the greatest or smallest possible value of a quantity.
For example:
-
What is the maximum height reached by a ball thrown into the air?
-
What is the minimum cost of producing a product?
-
At what point does a business earn its greatest profit?
-
What is the lowest temperature recorded during a day?
-
How can an engineer design a structure using the least amount of material?
These questions involve maximums and minimums, also known as extrema.
In mathematics, extrema are important features of functions because they help us understand the behaviour of graphs, identify turning points, compare different models, and solve optimisation problems.
A maximum is a greatest value, while a minimum is a smallest value. However, we must distinguish between values that are greatest or smallest over an entire domain and those that are greatest or smallest only compared with nearby values.
Understanding this distinction is essential when analysing functions.
What Is a Maximum Value?
A maximum value is the greatest output a function reaches over a specified domain or interval.
Consider the quadratic function:
f(x) = −x² + 9
Its graph is a downward-opening parabola.
The highest point is:
(0, 9)
Therefore:
-
The maximum value is 9.
-
The maximum occurs at x = 0.
-
The maximum point is (0, 9).
Notice the distinction between the maximum value and the point where it occurs.
The maximum value is a y-value.
The maximum point includes both the x-coordinate and the y-coordinate.
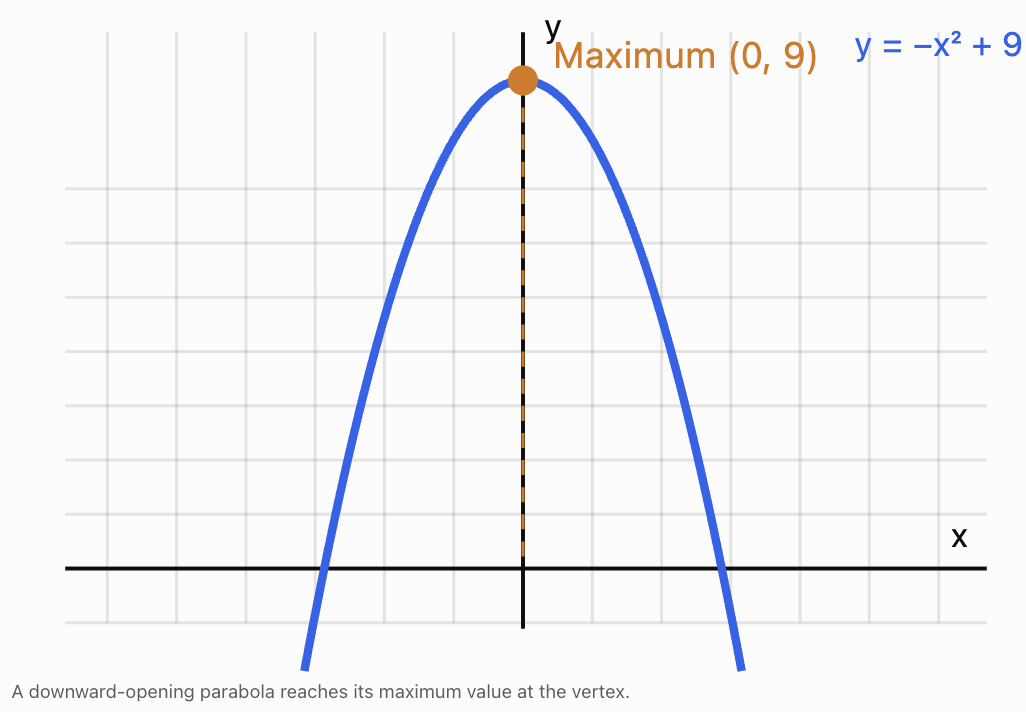
Maximum values and increasing or decreasing functions
For this graph:
-
The function increases as x approaches 0 from the left.
-
The function reaches its maximum at x = 0.
-
The function decreases as x moves to the right of 0.
A maximum often occurs where a graph changes from increasing to decreasing.
What Is a Minimum Value?
A minimum value is the smallest output a function reaches over a specified domain or interval.
Consider:
f(x) = x² − 4
The graph is an upward-opening parabola.
Its lowest point is:
(0, −4)
Therefore:
-
The minimum value is −4.
-
The minimum occurs at x = 0.
-
The minimum point is (0, −4).
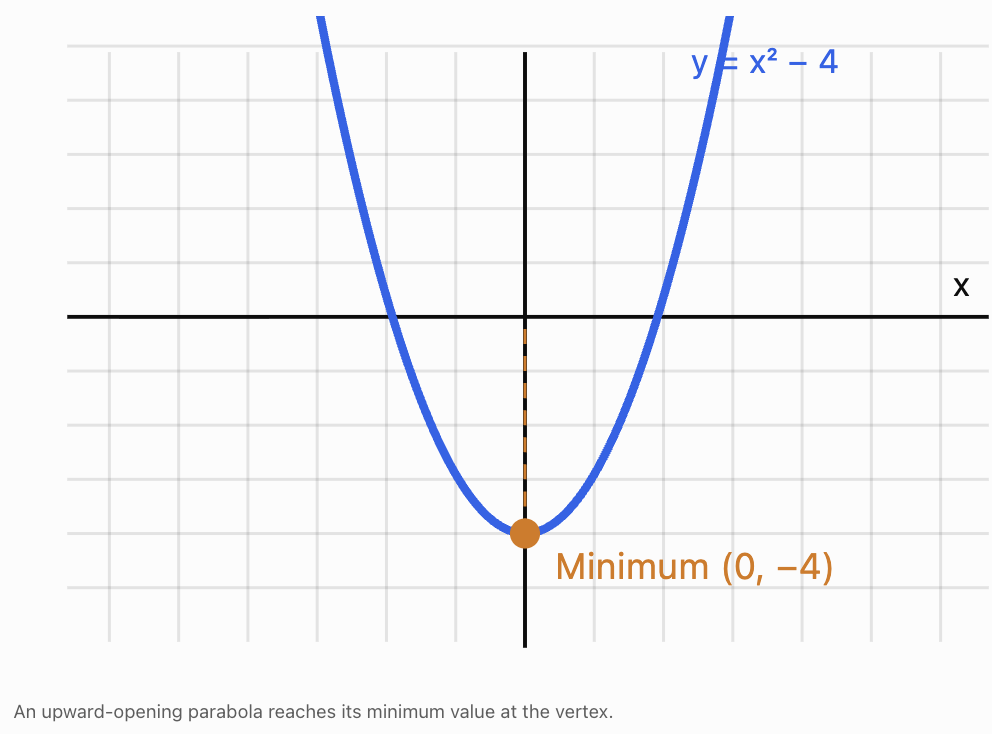
For this graph:
-
The function decreases until x = 0.
-
The function reaches its minimum.
-
The function then increases.
A minimum often occurs where a graph changes from decreasing to increasing.
Maximum and Minimum Points Versus Values
It is important to distinguish between three related ideas.
Consider:
f(x) = −2(x − 3)² + 10
The graph reaches its highest point at:
(3, 10)
We can describe this in three ways:
-
Maximum value: 10.
-
x-value where the maximum occurs: 3.
-
Maximum point: (3, 10).
These are not interchangeable.
If a question asks for the maximum value, the answer is 10.
If it asks where the maximum occurs, the answer is x = 3.
If it asks for the coordinates of the maximum point, the answer is (3, 10).
Local and Absolute Extrema
Not every maximum or minimum is the greatest or smallest value over an entire function.
We distinguish between local extrema and absolute extrema.
Local maximum
A local maximum occurs when a function's value is greater than or equal to nearby values.
The graph may rise to a peak, then fall.
However, another part of the graph may reach an even greater value.
Local minimum
A local minimum occurs when a function's value is less than or equal to nearby values.
The graph may fall into a valley, then rise.
However, another part of the graph may reach an even smaller value.
Absolute maximum
An absolute maximum is the greatest output of a function over its entire specified domain.
Absolute minimum
An absolute minimum is the smallest output of a function over its entire specified domain.
Type
Meaning
Local maximum
Greater than or equal to nearby outputs
Local minimum
Less than or equal to nearby outputs
Absolute maximum
Greatest output over the specified domain
Absolute minimum
Smallest output over the specified domain
Example: A cubic function
Consider:
f(x) = x³ − 3x
This function has:
-
A local maximum at (−1, 2).
-
A local minimum at (1, −2).
However, over all real numbers, the function has no absolute maximum or absolute minimum.
As x becomes increasingly large and positive, f(x) increases without bound.
As x becomes increasingly negative, f(x) decreases without bound.
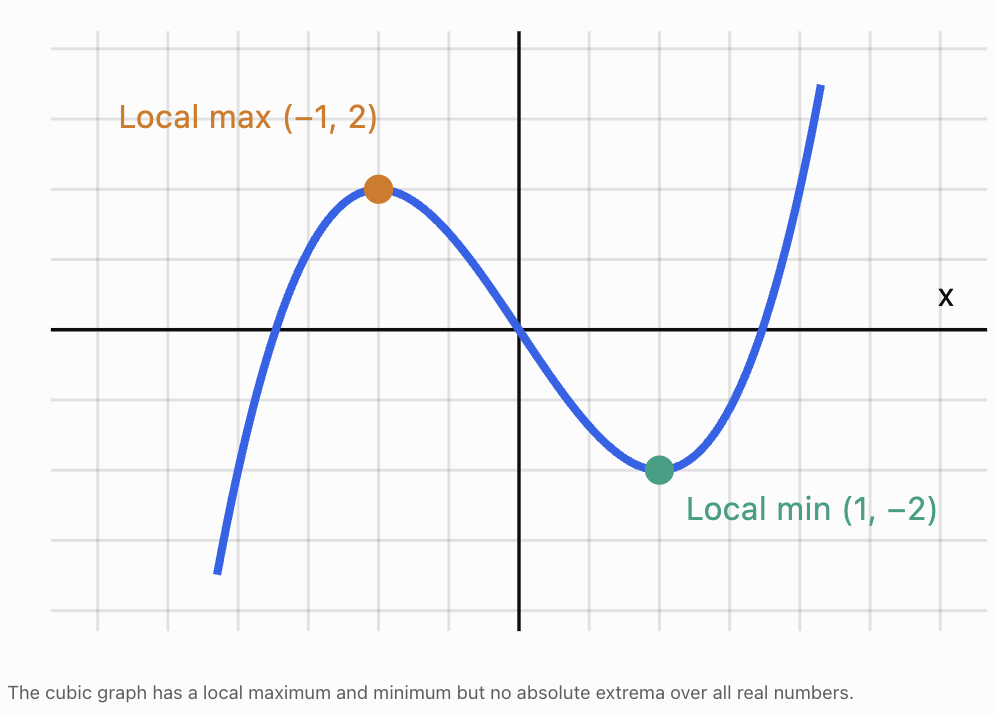
Turning Points
A turning point is a point where a graph changes direction.
There are two common types:
-
Increasing to decreasing: a local maximum.
-
Decreasing to increasing: a local minimum.
Identifying turning points visually
When reading a graph from left to right:
-
Find where the graph stops rising and starts falling.
-
Mark this as a possible local maximum.
-
Find where the graph stops falling and starts rising.
-
Mark this as a possible local minimum.
-
Read the coordinates of each point.
Turning points are especially important when analysing quadratic, cubic, and higher-degree polynomial functions.
Important distinction: Stationary points
A stationary point is a point where the derivative is zero, meaning the tangent is horizontal.
Some stationary points are turning points, but not all.
For example:
f(x) = x³
At x = 0, the graph has a horizontal tangent.
However, it continues increasing on both sides.
Therefore, (0, 0) is a stationary point but not a turning point.
Also, some turning points have sharp corners, such as the vertex of y = |x|, where the derivative is undefined.
This distinction becomes particularly important in calculus.
Finding Maximums and Minimums of Quadratic Functions
Quadratic functions are especially useful for studying extrema because their graphs have exactly one turning point.
The general form is:
f(x) = ax² + bx + c
where a ≠ 0.
The sign of a determines whether the vertex is a maximum or minimum.
-
If a > 0, the parabola opens upward and has a minimum.
-
If a < 0, the parabola opens downward and has a maximum.
The x-coordinate of the vertex is:
x = −b/(2a)
Once this x-value is known, substitute it into the function to find the maximum or minimum value.
Worked Example: Finding a minimum
Consider:
f(x) = 2x² − 12x + 11
Step 1: Identify the coefficients
a = 2
b = −12
c = 11
Because a is positive, the parabola opens upward.
Therefore, it has a minimum.
Step 2: Calculate the x-coordinate of the vertex
x = −b/(2a)
x = −(−12)/(2 × 2)
x = 12/4
x = 3
Step 3: Calculate the minimum value
Substitute x = 3:
f(3) = 2(3)² − 12(3) + 11
f(3) = 18 − 36 + 11
f(3) = −7
Answer:
-
Minimum value: −7
-
Minimum occurs at x = 3
-
Minimum point: (3, −7)
-
Axis of symmetry: x = 3
The function decreases on (−∞, 3) and increases on (3, ∞).
Worked Example: Finding a maximum
Consider:
g(x) = −3x² + 18x − 14
Because a = −3, the parabola opens downward.
The vertex occurs at:
x = −18/[2(−3)]
x = 3
Substitute:
g(3) = −3(3)² + 18(3) − 14
g(3) = −27 + 54 − 14
g(3) = 13
Answer:
-
Maximum value: 13
-
Maximum occurs at x = 3
-
Maximum point: (3, 13)
The function increases on (−∞, 3) and decreases on (3, ∞).
Finding Extrema Using Vertex Form
Quadratic functions can also be written in vertex form:
f(x) = a(x − h)² + k
The vertex is:
(h, k)
This makes it easy to identify the extremum without calculating −b/(2a).
Worked Example: Maximum
Consider:
f(x) = −4(x − 5)² + 20
The vertex is:
(5, 20)
Since a = −4, the parabola opens downward.
Therefore:
Maximum value = 20 at x = 5
Worked Example: Minimum
Consider:
g(x) = 0.5(x + 2)² − 6
Rewrite mentally as:
g(x) = 0.5(x − (−2))² − 6
The vertex is:
(−2, −6)
Since a = 0.5 is positive, the parabola opens upward.
Therefore:
Minimum value = −6 at x = −2
Why vertex form is useful
Vertex form makes three important properties immediately visible:
-
The horizontal position of the turning point.
-
The maximum or minimum value.
-
Whether the parabola opens upward or downward.
It is particularly useful in real-world optimisation problems.
Finding Extrema by Completing the Square
Sometimes a quadratic is given in standard form, but we want to rewrite it in vertex form.
This can be done by completing the square.
Worked Example
Find the minimum of:
f(x) = x² + 8x + 11
Start with:
f(x) = x² + 8x + 11
Half of 8 is 4.
Square 4 to get 16.
Rewrite:
f(x) = (x² + 8x + 16) − 16 + 11
Simplify:
f(x) = (x + 4)² − 5
The vertex is:
(−4, −5)
Because the squared expression cannot be negative:
(x + 4)² ≥ 0
Therefore:
(x + 4)² − 5 ≥ −5
The smallest possible output is −5.
Minimum value = −5 at x = −4
Completing the square does more than locate the vertex. It also explains algebraically why the value is a minimum.
Maximums and Minimums on Restricted Domains
A function's maximum and minimum values depend on the domain being considered.
For example:
f(x) = x²
Over all real numbers, the function has:
-
Absolute minimum: 0 at x = 0.
-
No absolute maximum.
However, suppose the domain is restricted to:
−2 ≤ x ≤ 3
Now the function has both an absolute minimum and an absolute maximum.
Calculate the important values:
f(−2) = 4
f(0) = 0
f(3) = 9
Therefore:
-
Absolute minimum: 0 at x = 0.
-
Absolute maximum: 9 at x = 3.
The maximum occurs at an endpoint, not at a turning point.
Worked Example: A restricted quadratic
Find the absolute maximum and minimum of:
f(x) = −x² + 4x + 1
on:
0 ≤ x ≤ 5
Step 1: Find the vertex
a = −1, b = 4
x = −4/[2(−1)]
x = 2
Step 2: Evaluate the vertex
f(2) = −4 + 8 + 1 = 5
Step 3: Evaluate the endpoints
f(0) = 1
f(5) = −25 + 20 + 1 = −4
Step 4: Compare
x
f(x)
0
1
2
5
5
−4
Therefore:
Absolute maximum = 5 at x = 2
Absolute minimum = −4 at x = 5
This example shows why checking only the vertex can give an incomplete answer.
For a continuous quadratic on a closed interval, evaluating the vertex when it lies inside the interval and evaluating both endpoints is sufficient to find its absolute extrema.
When a Maximum or Minimum Does Not Exist
Not every function reaches a greatest or smallest value.
Example: A linear function
Consider:
f(x) = 3x + 2
over all real numbers.
As x increases, f(x) increases without bound.
As x decreases, f(x) decreases without bound.
Therefore, the function has neither an absolute maximum nor an absolute minimum.
Example: An exponential function
Consider:
f(x) = 2ˣ
The function is always positive.
As x approaches negative infinity, its outputs approach zero.
However, the function never actually reaches zero.
Therefore:
-
It has no absolute minimum.
-
It has no absolute maximum.
Zero is the lower bound of its range, but it is not a minimum value.
Example: An open interval
Consider:
f(x) = x
with domain:
0 < x < 5
The function approaches zero and five but never reaches either endpoint.
Therefore, it has no absolute maximum or minimum on this domain.
This demonstrates an important distinction between a value that a function approaches and one that it actually reaches.
Finding Maximums and Minimums from Graphs
Sometimes we are given a graph without an equation.
In this situation, we estimate extrema visually.
Steps
-
Identify the domain shown on the graph.
-
Look for peaks and valleys.
-
Identify the x-coordinate of each peak or valley.
-
Read the corresponding y-value.
-
Determine whether each point is a local or absolute extremum.
-
Check the endpoints of the graph.
-
Use approximate values when the coordinates are not exact.
Example: A graph with several turning points
Suppose a graph has the following important points:
-
A local maximum at (−3, 5).
-
A local minimum at (0, −2).
-
Another local maximum at (4, 7).
The graph has at least two local maxima and one local minimum.
The greatest of the listed local maximum values is 7.
However, without knowing the entire graph and its domain, we cannot conclude that 7 is the absolute maximum.
Other parts of the function may reach greater values.
Estimating extrema from a graph
When a turning point lies between grid lines, estimate its coordinates.
For example, a maximum might appear near:
(2.4, 8.7)
We would write:
Approximate maximum value ≈ 8.7 at x ≈ 2.4
The approximation sign indicates that the coordinates were estimated rather than calculated exactly.
Comparing Extrema Across Different Functions
Maximum and minimum values provide useful information when comparing functions.
Consider three quadratic functions:
A: f(x) = −(x − 2)² + 8
B: g(x) = −2(x − 2)² + 12
C: h(x) = (x − 2)² − 3
Comparing their features
Feature
Function A
Function B
Function C
Opens
Downward
Downward
Upward
Vertex
(2, 8)
(2, 12)
(2, −3)
Extremum
Maximum
Maximum
Minimum
Extremum value
8
12
−3
x-value of extremum
2
2
2
Interpretation
Functions A and B both have maximum values, but B reaches a greater maximum.
Function C has a minimum rather than a maximum.
All three functions have their turning points at x = 2.
Therefore, their extrema occur at the same input value, even though their outputs and shapes differ.
Comparing graph widths
Function B has a larger absolute quadratic coefficient than Function A.
This means B is narrower.
However, the width of the parabola does not by itself determine the maximum or minimum value.
The vertical position of the vertex determines that value.
How Transformations Affect Extrema
Graph transformations are closely connected to maximums and minimums.
Start with:
f(x) = x²
Its minimum point is:
(0, 0)
Vertical translation
g(x) = x² + 5
The graph moves upward by 5.
The minimum changes from 0 to 5.
New minimum point:
(0, 5)
Horizontal translation
h(x) = (x − 3)²
The graph moves right by 3.
The minimum value remains 0, but it occurs at x = 3.
New minimum point:
(3, 0)
Reflection across the x-axis
p(x) = −x²
The graph is reflected vertically.
The original minimum becomes a maximum.
Maximum point:
(0, 0)
Vertical stretch
q(x) = 4(x − 2)² + 3
The graph is vertically stretched relative to the basic parabola, translated right by 2 and upward by 3.
Minimum point:
(2, 3)
The stretch changes the graph's width but does not change the vertex when applied to the squared term alone.
General conclusion
For:
y = a(x − h)² + k
-
h determines the horizontal position of the extremum.
-
k determines the extremum value.
-
The sign of a determines whether it is a maximum or minimum.
-
The magnitude of a determines the graph's vertical scaling.
Real-World Application: Maximum Height of a Projectile
Projectile motion is a common application of maximum values.
Suppose a ball is thrown upward from a platform.
Its height is modeled by:
h(t) = −5t² + 30t + 10
where:
-
h is height in metres.
-
t is time in seconds.
Step 1: Find the time of maximum height
The vertex occurs at:
t = −b/(2a)
a = −5, b = 30
t = −30/[2(−5)]
t = 3
Step 2: Find the maximum height
Substitute t = 3:
h(3) = −5(3)² + 30(3) + 10
h(3) = −45 + 90 + 10
h(3) = 55
Step 3: Interpret the result
Maximum height = 55 m
Time to maximum height = 3 s
The ball rises for the first 3 seconds, reaches its highest point, and then begins to fall.
This model assumes approximately constant gravitational acceleration and ignores air resistance.
Real-World Application: Maximum Business Profit
Businesses often try to identify the production or sales level that maximises profit.
Suppose profit is modeled by:
P(x) = −2x² + 120x − 1000
where:
-
x = number of products sold.
-
P(x) = profit in dollars.
Step 1: Determine the type of extremum
The coefficient of x² is negative.
Therefore, the parabola opens downward and has a maximum.
Step 2: Find the optimal sales quantity
x = −b/(2a)
x = −120/[2(−2)]
x = 30
Step 3: Find maximum profit
P(30) = −2(30)² + 120(30) − 1000
P(30) = −1800 + 3600 − 1000
P(30) = 800
Interpretation
Maximum modeled profit = $800
This occurs when 30 products are sold.
Selling fewer or more than 30 products produces a lower profit under the model.
The model is an idealised example; actual business decisions also depend on demand, production limits, and other costs.
Real-World Application: Minimising Costs
Not all optimisation problems involve finding a maximum.
Businesses and engineers often want to minimise costs.
Suppose the operating cost of a process is:
C(x) = 3(x − 12)² + 450
where x represents the number of operating hours per day.
The vertex is:
(12, 450)
Since the quadratic coefficient is positive, the graph opens upward.
Therefore:
Minimum cost = $450
This occurs at:
x = 12 hours
The model suggests that operating for either fewer or more than 12 hours increases the cost.
This might represent a process where very short operating periods create inefficiencies while very long periods lead to overtime or maintenance costs.
Real-World Application: Maximum Area
Optimisation is also important in geometry.
Suppose a farmer has 40 metres of fencing to enclose a rectangular field.
What dimensions give the greatest possible area?
Step 1: Write the perimeter equation
For a rectangle:
P = 2L + 2W
Since the perimeter is 40:
2L + 2W = 40
Divide by 2:
L + W = 20
Therefore:
L = 20 − W
Step 2: Write the area equation
Area = length × width
A = LW
Substitute L = 20 − W:
A(W) = W(20 − W)
Expand:
A(W) = −W² + 20W
Step 3: Find the maximum
The quadratic coefficient is negative, so the parabola opens downward.
The vertex occurs at:
W = −20/[2(−1)]
W = 10
Then:
L = 20 − 10
L = 10
Step 4: Calculate the area
A = 10 × 10
Maximum area = 100 m²
The greatest area occurs when the rectangle is a square measuring 10 m by 10 m.
Why this matters
The same mathematical idea can be applied to:
-
Designing gardens.
-
Minimising packaging materials.
-
Maximising storage capacity.
-
Optimising the dimensions of containers.
-
Reducing construction costs.
Real-World Application: Temperature Extremes
Suppose the temperature during part of a day is modeled by:
T(t) = −0.5(t − 14)² + 32
where t is the hour of the day.
The vertex is:
(14, 32)
The parabola opens downward.
Therefore:
Maximum temperature = 32°C at 14:00 (2:00 p.m.)
If the model applies only from 8:00 to 20:00, we can also determine the minimum over this interval.
At t = 8:
T(8) = −0.5(8 − 14)² + 32
T(8) = −18 + 32 = 14°C
At t = 20:
T(20) = −0.5(20 − 14)² + 32
T(20) = 14°C
Therefore, over the specified interval:
-
Maximum: 32°C at 14:00.
-
Minimum: 14°C at 8:00 and 20:00.
This is an illustrative temperature model rather than a prediction of actual weather.
Finding Extrema from Tables of Values
Sometimes a function is represented by a table rather than an equation or graph.
Consider the following measurements:
Time (min)
Temperature (°C)
0
18
5
23
10
28
15
31
20
29
25
24
30
20
The highest recorded temperature is 31°C at 15 minutes.
The lowest recorded temperature is 18°C at 0 minutes.
Therefore:
-
Recorded maximum: 31°C at 15 min.
-
Recorded minimum: 18°C at 0 min.
However, these are the extrema among the recorded measurements.
The temperature might have reached a slightly higher or lower value between measurements.
A continuous graph or mathematical model would be needed to investigate that possibility.
Comparing two datasets
Suppose two experiments produce the following results:
Time (min)
Experiment A
Experiment B
0
10
15
5
18
22
10
25
28
15
30
26
20
27
20
Experiment A has a recorded maximum of 30 at 15 minutes.
Experiment B has a recorded maximum of 28 at 10 minutes.
Therefore:
-
Experiment A reaches a higher recorded maximum.
-
Experiment B reaches its recorded maximum earlier.
-
The experiments have different trends after reaching their peaks.
Comparing extrema helps us understand not only how high or low a quantity becomes but also when important events occur.
Extrema of Other Function Families
Quadratic functions are not the only functions that can have maximums or minimums.
Absolute value functions
Consider:
f(x) = |x − 3| + 2
The graph has a V shape.
Its vertex is:
(3, 2)
Therefore:
Minimum value = 2 at x = 3
Now consider:
g(x) = −|x + 1| + 5
This graph is an upside-down V.
Its vertex is:
(−1, 5)
Therefore:
Maximum value = 5 at x = −1
These are examples of extrema at sharp turning points.
Cubic functions
Consider:
f(x) = x³ − 3x
The function has a local maximum at (−1, 2) and a local minimum at (1, −2).
Unlike a quadratic, it has more than one turning point.
Trigonometric functions
Consider:
f(x) = sin x
The sine function repeatedly reaches:
-
Maximum value: 1.
-
Minimum value: −1.
These extrema repeat periodically.
For a transformed sine function:
g(x) = 3 sin x + 2
The amplitude is 3 and the midline is y = 2.
Therefore:
Maximum = 2 + 3 = 5
Minimum = 2 − 3 = −1
Exponential functions
Consider:
f(x) = 2ˣ
Over all real numbers, this function has no maximum or minimum.
It increases without bound and approaches zero without reaching it.
These examples demonstrate that extrema depend on the function's shape and domain.
An Introduction to Calculus and Extrema
For more advanced functions, calculus provides a systematic method for locating possible extrema.
The derivative measures the instantaneous rate of change of a function.
It is commonly written as:
f′(x)
For a smooth function:
-
f′(x) > 0 means the function is increasing locally.
-
f′(x) < 0 means the function is decreasing locally.
-
f′(x) = 0 identifies a stationary point.
A stationary point may be a local maximum, local minimum, or neither.
Worked Example: Using the derivative
Consider:
f(x) = x³ − 3x
Differentiate:
f′(x) = 3x² − 3
Set the derivative equal to zero:
3x² − 3 = 0
3x² = 3
x² = 1
x = −1 or x = 1
These are the stationary points.
Evaluate the function:
f(−1) = (−1)³ − 3(−1)
f(−1) = −1 + 3 = 2
f(1) = 1 − 3 = −2
The stationary points are:
(−1, 2) and (1, −2)
Now examine the sign of the derivative:
Interval
Sign of f′(x)
Behaviour
x < −1
Positive
Increasing
−1 < x < 1
Negative
Decreasing
x > 1
Positive
Increasing
Therefore:
-
At x = −1, the function changes from increasing to decreasing: local maximum.
-
At x = 1, the function changes from decreasing to increasing: local minimum.
Important limitation
Finding f′(x) = 0 identifies possible extrema, but it does not guarantee an extremum.
We must also check where the derivative changes sign or use another appropriate test.
For absolute extrema on a closed interval, endpoints must also be considered.
For functions with corners or other nondifferentiable points, extrema can occur even when the derivative does not exist.
A Step-by-Step Strategy for Finding Extrema
When solving a maximum or minimum problem, use the following approach.
Identify the function.
Determine the equation or graph representing the quantity.
Identify the domain.
Decide which input values are allowed or meaningful.
Locate possible extrema.
For quadratics, find the vertex.
For graphs, identify peaks, valleys, and relevant endpoints.
For more advanced functions, investigate stationary points and points where the derivative is undefined.
Calculate the output values.
Substitute the relevant x-values into the function.
Compare the values.
Determine which is greatest or smallest over the specified domain.
Interpret the result.
Explain the meaning using appropriate units.
Check whether the result is realistic.
Consider restrictions such as time, cost, distance, and production capacity.
Common Mistakes
Confusing the maximum value with the x-coordinate where it occurs
If the maximum point is (3, 10), the maximum value is 10, not 3.
Assuming every turning point is an absolute extremum
A turning point may be only a local maximum or minimum.
Ignoring the domain
A function may have different extrema when its domain is restricted.
Forgetting to check endpoints
Absolute extrema on a closed interval may occur at endpoints.
Assuming every function has a maximum and minimum
Some functions increase or decrease without bound.
Confusing the sign of the vertex's y-coordinate with the type of extremum
A negative value can be a maximum, and a positive value can be a minimum.
Assuming all stationary points are turning points
The function y = x³ has a stationary point at the origin but no turning point there.
Misidentifying the direction of a parabola
For y = ax² + bx + c, a positive coefficient gives a minimum, while a negative coefficient gives a maximum.
Ignoring units in real-world problems
A maximum height must be expressed in units of length, while maximum profit is expressed in currency.
Treating recorded data extrema as exact continuous extrema
The greatest measured value may not be the greatest value reached between measurements.
Key Terms
-
Maximum value: The greatest output of a function over a specified domain.
-
Minimum value: The smallest output of a function over a specified domain.
-
Extremum: A maximum or minimum.
-
Extrema: The plural of extremum.
-
Local maximum: A value greater than or equal to nearby function values.
-
Local minimum: A value less than or equal to nearby function values.
-
Absolute maximum: The greatest output over the entire specified domain.
-
Absolute minimum: The smallest output over the entire specified domain.
-
Turning point: A point where a graph changes from increasing to decreasing or vice versa.
-
Vertex: The turning point of a parabola.
-
Axis of symmetry: A line dividing a symmetric graph into matching halves.
-
Stationary point: A point where the derivative equals zero.
-
Derivative: A measure of the instantaneous rate of change of a function.
-
Critical point: An interior point where the derivative is zero or undefined, under the usual calculus definition.
-
Optimisation: The process of finding the greatest or smallest possible value of a quantity.
-
Restricted domain: A specified subset of permitted input values.
-
Endpoint: A boundary value of an interval.
-
Quadratic function: A function with a squared variable as its highest power.
-
Vertex form: A quadratic equation written as y = a(x − h)² + k.
-
Completing the square: An algebraic method for rewriting a quadratic expression in squared form.
Key Takeaways
-
Maximums and minimums describe the greatest and smallest outputs of functions.
-
A maximum or minimum value is a y-value, while an extremum point includes both coordinates.
-
Local extrema describe behaviour near a point.
-
Absolute extrema describe the greatest or smallest values over the specified domain.
-
Turning points often occur where a graph changes between increasing and decreasing.
-
Upward-opening parabolas have a minimum at the vertex.
-
Downward-opening parabolas have a maximum at the vertex.
-
The vertex of y = ax² + bx + c occurs at x = −b/(2a).
-
Vertex form y = a(x − h)² + k makes the extremum easy to identify.
-
Restricted domains can change the absolute maximum and minimum.
-
Endpoints must be considered when finding absolute extrema on closed intervals.
-
Some functions have no absolute maximum or minimum.
-
Extrema are useful for solving real-world optimisation problems.
-
Comparing extrema helps us evaluate different functions, models, and situations.
Check Your Understanding
Recall and Understanding
1. Explain the difference between a maximum value and a maximum point.
2. What is the difference between a local maximum and an absolute maximum?
3. Describe how to identify a minimum point from a graph.
4. Explain why a linear function such as y = 3x + 2 has no absolute maximum or minimum over all real numbers.
Application
5. Find the minimum value and vertex of f(x) = x² − 8x + 10.
6. Find the maximum value and vertex of g(x) = −2x² + 12x − 7.
7. Identify the extremum of h(x) = 3(x − 4)² + 6.
8. Identify the extremum of p(x) = −5(x + 2)² + 11.
9. Find the absolute maximum and minimum of f(x) = x² − 4x + 1 on the interval 0 ≤ x ≤ 5.
10. Determine the maximum and minimum values of y = 4 sin x − 3.
Analysis and Challenge
11. A ball's height is modeled by h(t) = −5t² + 40t + 3. Find its maximum height and the time at which it occurs.
12. A company's profit is modeled by P(x) = −4x² + 160x − 900. Find the production quantity that maximises profit and calculate the maximum profit.
13. A rectangle has a perimeter of 60 cm. Find the dimensions that maximise its area and calculate that area.
14. Compare the extrema of:
A: f(x) = −(x − 3)² + 12
B: g(x) = −3(x − 3)² + 18
C: h(x) = 2(x − 3)² − 5
15. A student claims that the function f(x) = x³ − 3x has an absolute maximum at (−1, 2) because this point is a local maximum. Explain why the claim is incorrect.
Answers to Check Your Understanding
1. The maximum value is the greatest y-value of a function over a specified domain. The maximum point gives both the x-coordinate where it occurs and the maximum y-value.
For example, if the maximum point is (4, 10), the maximum value is 10.
2. A local maximum is greater than or equal to nearby outputs. An absolute maximum is the greatest output over the entire specified domain.
3. Look for a point where the graph stops decreasing and begins increasing. This is a local minimum. To determine whether it is an absolute minimum, compare it with all other relevant values, including endpoints.
4. The function y = 3x + 2 increases without bound as x increases and decreases without bound as x decreases. Therefore, it has neither an absolute maximum nor an absolute minimum over all real numbers.
5.
f(x) = x² − 8x + 10
a = 1, b = −8
x = −b/(2a)
x = 8/2 = 4
Substitute:
f(4) = 16 − 32 + 10
f(4) = −6
Minimum value = −6
Vertex = (4, −6)
6.
g(x) = −2x² + 12x − 7
a = −2, b = 12
x = −12/[2(−2)]
x = 3
Substitute:
g(3) = −2(9) + 12(3) − 7
g(3) = −18 + 36 − 7
g(3) = 11
Maximum value = 11
Vertex = (3, 11)
7.
h(x) = 3(x − 4)² + 6
The vertex is (4, 6).
Because the quadratic coefficient is positive, the parabola opens upward.
Minimum value = 6 at x = 4
8.
p(x) = −5(x + 2)² + 11
The vertex is (−2, 11).
Because the quadratic coefficient is negative, the parabola opens downward.
Maximum value = 11 at x = −2
9.
f(x) = x² − 4x + 1
Domain:
0 ≤ x ≤ 5
Find the vertex:
x = −(−4)/(2 × 1) = 2
Evaluate:
f(0) = 1
f(2) = 4 − 8 + 1 = −3
f(5) = 25 − 20 + 1 = 6
Compare:
-
f(0) = 1
-
f(2) = −3
-
f(5) = 6
Absolute minimum = −3 at x = 2
Absolute maximum = 6 at x = 5
10.
y = 4 sin x − 3
Since:
−1 ≤ sin x ≤ 1
Multiplying by 4:
−4 ≤ 4 sin x ≤ 4
Subtracting 3:
−7 ≤ 4 sin x − 3 ≤ 1
Therefore:
Maximum value = 1
Minimum value = −7
11.
h(t) = −5t² + 40t + 3
Find the vertex:
t = −40/[2(−5)]
t = 4
Calculate:
h(4) = −5(4)² + 40(4) + 3
h(4) = −80 + 160 + 3
h(4) = 83
Maximum height = 83 m
Time to maximum height = 4 s
12.
P(x) = −4x² + 160x − 900
The vertex occurs at:
x = −160/[2(−4)]
x = 20
Substitute:
P(20) = −4(20)² + 160(20) − 900
P(20) = −1600 + 3200 − 900
P(20) = 700
Optimal production quantity = 20 products
Maximum modeled profit = $700
13.
Let the rectangle have length L and width W.
Perimeter:
2L + 2W = 60
L + W = 30
L = 30 − W
Area:
A = LW
A(W) = W(30 − W)
A(W) = −W² + 30W
Find the vertex:
W = −30/[2(−1)]
W = 15
Therefore:
L = 30 − 15 = 15
Area:
A = 15 × 15 = 225
Dimensions = 15 cm × 15 cm
Maximum area = 225 cm²
14.
Function
Vertex
Extremum
A
(3, 12)
Maximum of 12
B
(3, 18)
Maximum of 18
C
(3, −5)
Minimum of −5
All three functions have their extrema at x = 3.
Function B has the greatest maximum value.
Function C opens upward and therefore has a minimum rather than a maximum.
Function B is narrower than Function A because its quadratic coefficient has a greater absolute value.
15.
The function:
f(x) = x³ − 3x
has a local maximum at (−1, 2).
However, it continues increasing without bound as x approaches positive infinity.
Therefore, there are values of x for which f(x) is greater than 2.
The point (−1, 2) is only a local maximum.
The function has no absolute maximum over all real numbers.
Final Summary
Maximums and minimums are essential features of functions because they help identify the greatest and smallest possible values of quantities.
By locating turning points, analysing quadratic equations, examining graphs, and considering restricted domains, we can determine where extrema occur and what they mean.
These skills are particularly important in optimisation problems involving height, profit, cost, area, temperature, and other real-world quantities.
The central idea is that finding an extremum requires understanding both the value of a function and the domain over which that value is being compared.
-