Analyzing and Interpreting Graphs
1. Intercepts
Learning outcomes
- I can identify x-intercepts.
- I can identify y-intercepts.
- I can interpret intercepts in context.
- I can estimate intercepts from graphs.
- I can compare intercepts of different functions.
Introduction
When studying graphs, one of the first things we often want to know is where the graph meets the coordinate axes.
These points are called intercepts.
Intercepts help us understand the behaviour of functions, solve equations, compare graphs, and interpret mathematical relationships in real-world situations.
For example, consider the linear function:
y = 2x − 6
The graph crosses the x-axis at (3, 0) and the y-axis at (0, −6).
These two points tell us important information:
-
The x-intercept shows where the output equals zero.
-
The y-intercept shows the output when the input equals zero.
In a business model, an x-intercept might represent a break-even point, while a y-intercept might represent an initial cost or starting balance.
In physics, an x-intercept on a height-time graph might represent when an object reaches ground level, while the y-intercept represents its initial height.
Intercepts are useful for linear, quadratic, exponential, polynomial, and many other types of functions.
What Is an Intercept?
An intercept is a point where a graph intersects one of the coordinate axes.
There are two main types:
-
x-intercepts: Points where the graph meets the x-axis.
-
y-intercepts: Points where the graph meets the y-axis.
The x-axis is the horizontal axis.
The y-axis is the vertical axis.
Every point on the x-axis has a y-coordinate of zero.
Every point on the y-axis has an x-coordinate of zero.
This gives us two essential rules:
To find an x-intercept, set y = 0.
To find a y-intercept, set x = 0.
Visualising Intercepts
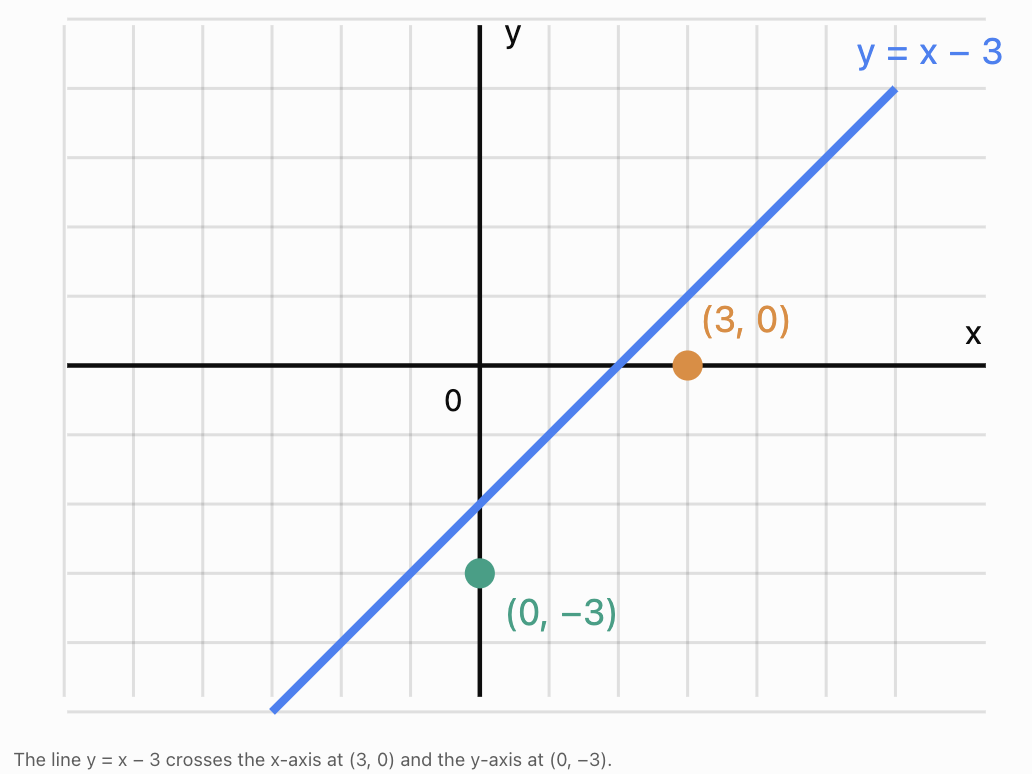
The orange point represents the x-intercept.
The green point represents the y-intercept.
Both intercepts can be found directly from the equation.
Understanding x-Intercepts
An x-intercept is a point where a graph meets the x-axis.
At an x-intercept:
y = 0
For a function written as:
y = f(x)
we find x-intercepts by solving:
f(x) = 0
The resulting x-values are also called the zeros or roots of the function.
Worked Example: Finding an x-intercept
Consider:
y = 3x − 12
Set y = 0:
0 = 3x − 12
Add 12:
12 = 3x
Divide by 3:
x = 4
Therefore, the x-intercept is:
(4, 0)
Verification
Substitute x = 4 into the original equation:
y = 3(4) − 12
y = 12 − 12
y = 0
The point lies on the x-axis, so the answer is correct.
Understanding y-Intercepts
A y-intercept is a point where a graph meets the y-axis.
At a y-intercept:
x = 0
To find the y-intercept, substitute x = 0 into the equation.
Worked Example: Finding a y-intercept
Consider:
y = 3x − 12
Substitute x = 0:
y = 3(0) − 12
y = −12
Therefore, the y-intercept is:
(0, −12)
Comparing the two intercepts
For:
y = 3x − 12
-
x-intercept: (4, 0).
-
y-intercept: (0, −12).
These points can be plotted and connected to sketch the straight line.
Intercepts of Linear Functions
A linear function has the general form:
y = mx + c
where:
-
m is the gradient.
-
c is the y-intercept value.
Finding the y-intercept
Set x = 0:
y = m(0) + c
y = c
Therefore:
y-intercept = (0, c)
Finding the x-intercept
Set y = 0:
0 = mx + c
mx = −c
If m ≠ 0:
x = −c/m
Therefore:
x-intercept = (−c/m, 0)
These formulas are useful when analyzing straight-line graphs.
Worked Example
Find both intercepts of:
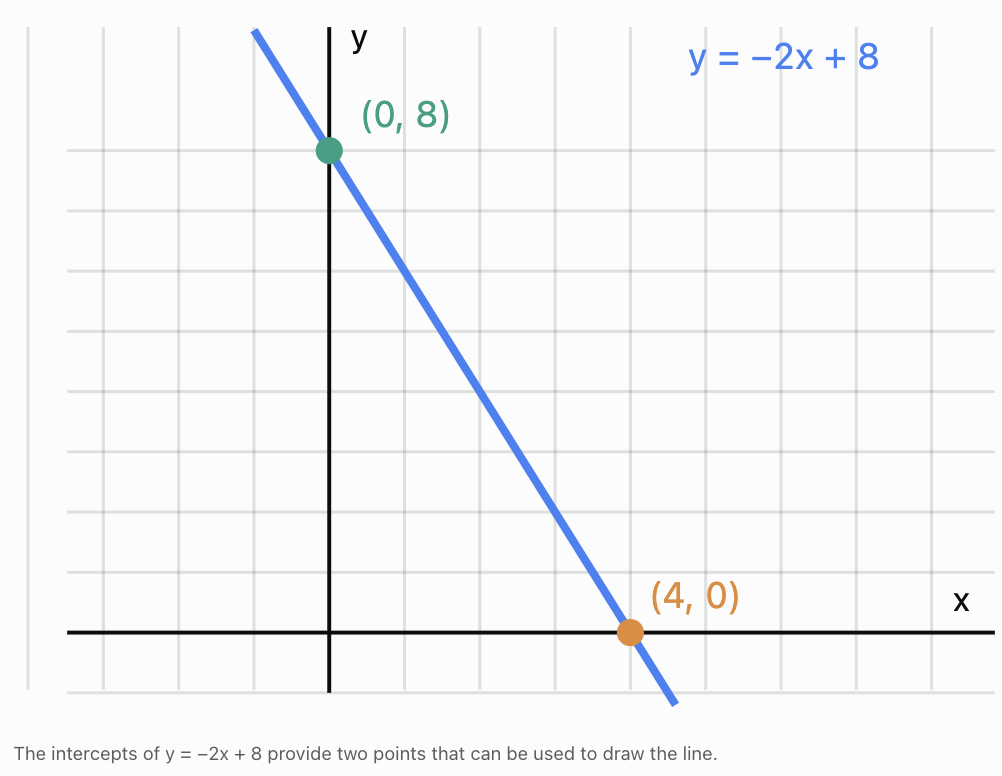
y = −2x + 8
x-intercept
Set y = 0:
0 = −2x + 8
2x = 8
x = 4
x-intercept: (4, 0)
y-intercept
Set x = 0:
y = −2(0) + 8
y = 8
y-intercept: (0, 8)
Using Intercepts to Sketch Linear Graphs
A straight line can be drawn using any two distinct points.
If a line has different x- and y-intercepts, these provide two convenient points.
Worked Example
Sketch:
y = 4x − 8
Find the x-intercept:
0 = 4x − 8
x = 2
Point: (2, 0)
Find the y-intercept:
x = 0
y = −8
Point: (0, −8)
Plot the two points and draw a straight line through them.
Special case: A line through the origin
Consider:
y = 3x
The x-intercept and y-intercept are both:
(0, 0)
These are not two distinct points.
To sketch the line, choose an additional point.
For example, when x = 1:
y = 3
So the line also passes through (1, 3).
Horizontal and vertical lines
The horizontal line y = 4 has a y-intercept at (0, 4), but no x-intercept.
The vertical line x = 3 has an x-intercept at (3, 0), but no y-intercept.
The horizontal line y = 0 lies along the x-axis, so every point on it is an x-intercept.
The vertical line x = 0 lies along the y-axis, so every point on it is a y-intercept.
These special cases remind us that not every graph has exactly one intercept of each type.
Intercepts of Quadratic Functions
Quadratic functions have the general form:
y = ax² + bx + c
where a ≠ 0.
Their graphs are parabolas.
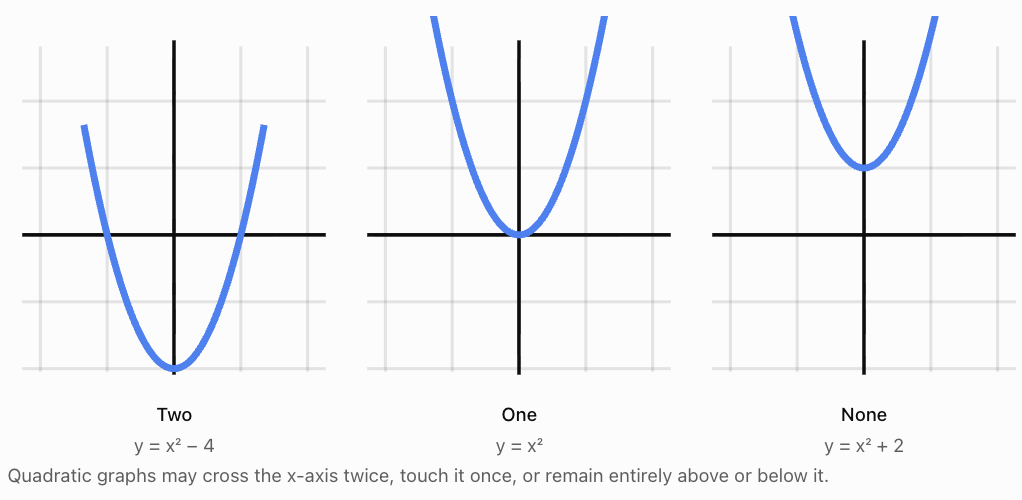
A parabola may have:
-
Two distinct x-intercepts.
-
Exactly one x-intercept, where it touches the x-axis.
-
No x-intercepts.
A quadratic function always has one y-intercept.
Finding the y-intercept
Set x = 0:
y = a(0)² + b(0) + c
y = c
Therefore:
y-intercept = (0, c)
Worked Example: Two x-intercepts
Consider:
y = x² − 5x + 6
Set y = 0:
0 = x² − 5x + 6
Factor:
0 = (x − 2)(x − 3)
Therefore:
x − 2 = 0 or x − 3 = 0
x = 2 or x = 3
The x-intercepts are:
(2, 0) and (3, 0)
To find the y-intercept, substitute x = 0:
y = 0² − 5(0) + 6
y = 6
y-intercept = (0, 6)
Worked Example: One x-intercept
Consider:
y = (x − 4)²
Set y = 0:
0 = (x − 4)²
x = 4
The parabola touches the x-axis at:
(4, 0)
This is a repeated root.
The graph does not cross the x-axis at this point; it touches the axis and turns around.
Worked Example: No x-intercepts
Consider:
y = x² + 3
Set y = 0:
0 = x² + 3
x² = −3
There are no real solutions because the square of a real number cannot be negative.
Therefore, the graph has no x-intercepts.
Its y-intercept is (0, 3).
The Discriminant and x-Intercepts
For a quadratic equation:
ax² + bx + c = 0
the discriminant is:
D = b² − 4ac
The discriminant tells us how many distinct real roots the quadratic has.
|
Discriminant |
Number of x-intercepts |
|---|---|
|
D > 0 |
Two distinct x-intercepts |
|
D = 0 |
One x-intercept |
|
D < 0 |
No x-intercepts |
Worked Example
Consider:
y = 2x² − 4x + 5
Identify:
a = 2, b = −4, c = 5
Calculate:
D = (−4)² − 4(2)(5)
D = 16 − 40
D = −24
Since D < 0, the graph has no x-intercepts.
Its y-intercept is:
(0, 5)
Intercepts of Other Function Families
The same intercept rules apply to other functions, although the algebraic methods may differ.
Absolute value functions
Consider:
y = |x − 3| − 2
For x-intercepts:
0 = |x − 3| − 2
|x − 3| = 2
Therefore:
x − 3 = 2 or x − 3 = −2
x = 5 or x = 1
x-intercepts:
(1, 0) and (5, 0)
For the y-intercept:
y = |0 − 3| − 2 = 1
(0, 1)
Square root functions
Consider:
y = √(x + 1) − 2
For the x-intercept:
0 = √(x + 1) − 2
√(x + 1) = 2
x + 1 = 4
x = 3
x-intercept = (3, 0)
For the y-intercept:
y = √1 − 2 = −1
y-intercept = (0, −1)
Exponential functions
Consider:
y = 2ˣ − 4
For the x-intercept:
0 = 2ˣ − 4
2ˣ = 4
x = 2
x-intercept = (2, 0)
For the y-intercept:
y = 2⁰ − 4
y = 1 − 4 = −3
y-intercept = (0, −3)
Notice that y = 2ˣ has no x-intercept because 2ˣ is always positive. Translating it downward by 4 creates an x-intercept.
Rational functions
Consider:
y = (x − 2)/(x + 3)
For the x-intercept, set the numerator equal to zero, provided the denominator is not zero:
x − 2 = 0
x = 2
x-intercept = (2, 0)
For the y-intercept, substitute x = 0:
y = −2/3
y-intercept = (0, −2/3)
The function is undefined at x = −3, so this value cannot be an intercept.
Estimating Intercepts from Graphs
Sometimes a graph is available but its equation is unknown.
In these situations, intercepts can be estimated by reading the coordinate axes.
Steps for estimating an x-intercept
-
Locate the point where the graph meets the x-axis.
-
Read its approximate x-coordinate.
-
Write the point in the form (x, 0).
-
Include an approximation sign if the value is not exact.
Steps for estimating a y-intercept
-
Locate the point where the graph meets the y-axis.
-
Read its approximate y-coordinate.
-
Write the point in the form (0, y).
-
Check the graph's scale carefully.
Worked Example
Suppose a curve crosses the x-axis slightly to the right of x = 1.5 and again near x = 4.2.
Its estimated x-intercepts might be:
(1.6, 0) and (4.2, 0)
If it crosses the y-axis near y = 7:
Estimated y-intercept = (0, 7)
These estimates should not be treated as exact values unless supported by an equation or precise data.
Estimating with an interactive graph
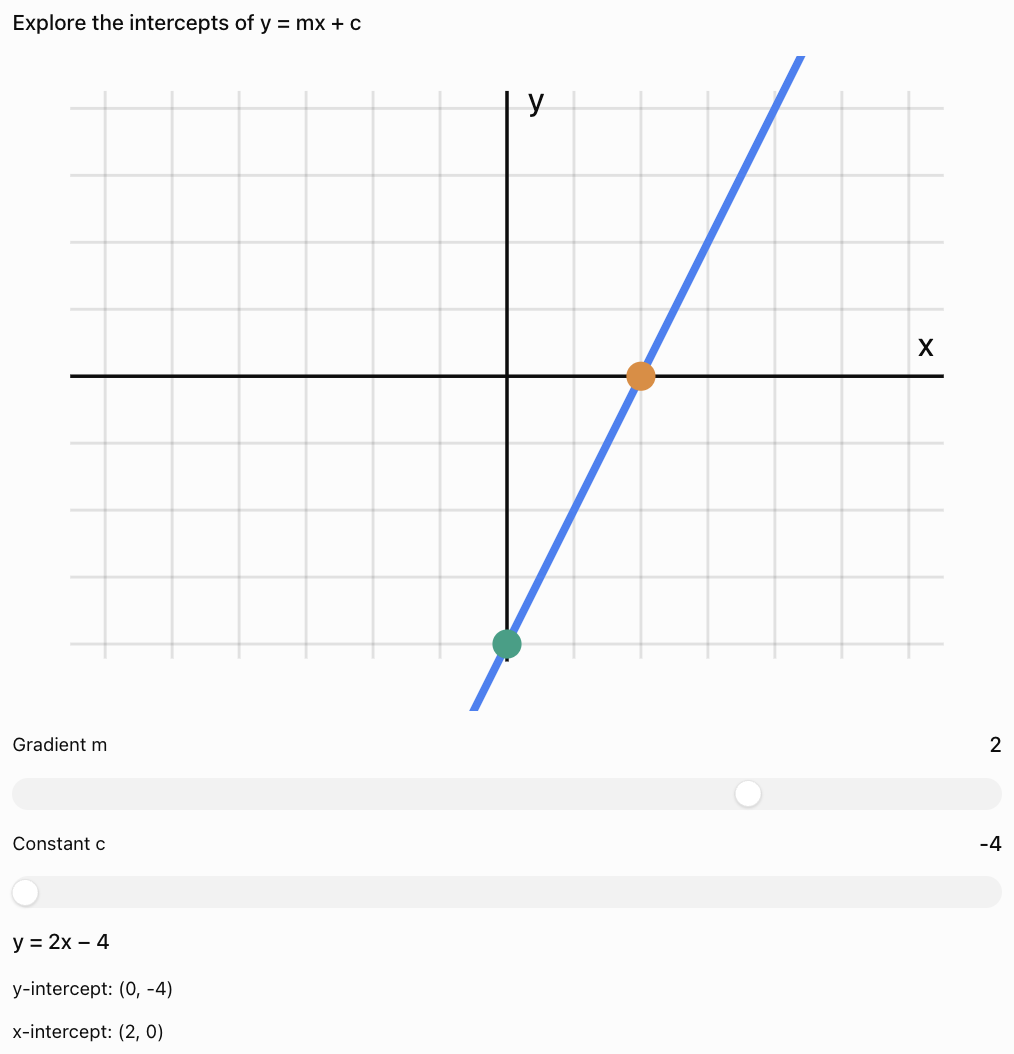
For classroom notes, the essential rules and calculations remain in the ordinary text above; the graph is an optional exploration.
Interpreting Intercepts in Real-World Situations
Intercepts become especially meaningful when a graph represents a real quantity.
Their interpretation depends on the variables, units, and context.
Application: Business break-even points
Suppose a company's profit is modeled by:
P(x) = 25x − 1000
where:
-
x = number of products sold.
-
P(x) = profit in dollars.
Finding the y-intercept
Set x = 0:
P(0) = 25(0) − 1000
P(0) = −1000
The y-intercept is:
(0, −1000)
This means the company has a loss of $1,000 when no products are sold.
Finding the x-intercept
Set P(x) = 0:
0 = 25x − 1000
25x = 1000
x = 40
The x-intercept is:
(40, 0)
This is the break-even point.
The company must sell 40 products to reach zero profit under this model.
For fewer than 40 products, the company makes a loss. For more than 40 products, it makes a profit.
Application: Height and Time
Suppose the height of a ball above the ground is:
h(t) = −5t² + 20t + 5
where:
-
h is height in metres.
-
t is time in seconds.
Finding the y-intercept
Set t = 0:
h(0) = 5
The intercept is:
(0, 5)
The ball starts 5 m above the ground.
Finding the x-intercepts
Set h(t) = 0:
0 = −5t² + 20t + 5
Divide by −5:
t² − 4t − 1 = 0
Using the quadratic formula:
t = 2 ± √5
Approximately:
t = −0.24 or t = 4.24
Mathematically, the graph has two x-intercepts.
However, if the model applies only from the moment the ball is released, t ≥ 0, the negative solution is outside the physical domain.
Therefore, the meaningful intercept is:
(4.24, 0), approximately
The ball reaches the ground after approximately 4.24 seconds.
This demonstrates why intercepts must be interpreted in context.
Application: Temperature
Suppose the temperature of a cooling substance is modeled by:
T(t) = 60 − 4t
where:
-
T is temperature in °C.
-
t is time in minutes.
y-intercept
T(0) = 60
The y-intercept is (0, 60).
This represents the initial temperature of 60°C.
x-intercept
Set T = 0:
0 = 60 − 4t
4t = 60
t = 15
The x-intercept is (15, 0).
This represents the time when the modeled temperature reaches 0°C.
The model is only appropriate over a time interval where its assumptions remain reasonable. It does not imply that the substance continues cooling linearly indefinitely.
Application: Water in a Tank
A tank contains 500 litres of water and drains at a constant rate of 20 litres per minute.
The volume is modeled by:
V(t) = 500 − 20t
where:
-
V = volume in litres.
-
t = time in minutes.
The y-intercept is:
(0, 500)
This represents the initial volume.
For the x-intercept:
0 = 500 − 20t
20t = 500
t = 25
x-intercept = (25, 0)
The tank becomes empty after 25 minutes.
The practical domain is:
0 ≤ t ≤ 25
The practical range is:
0 ≤ V ≤ 500
Comparing Intercepts of Different Functions
Intercepts provide a convenient way to compare mathematical models.
Consider three linear functions:
A: y = 2x + 4
B: y = 2x − 6
C: y = −x + 4
Calculate the intercepts
|
Function |
x-intercept |
y-intercept |
|---|---|---|
|
A: y = 2x + 4 |
(−2, 0) |
(0, 4) |
|
B: y = 2x − 6 |
(3, 0) |
(0, −6) |
|
C: y = −x + 4 |
(4, 0) |
(0, 4) |
Compare A and B
Both lines have gradient 2.
Therefore, they are parallel.
Their y-intercepts differ by 10 units.
Graph B is a vertical translation of Graph A downward by 10 units.
Their x-intercepts are also different.
Compare A and C
Both lines have the same y-intercept:
(0, 4)
However, their gradients are different.
Graph A increases from left to right, while Graph C decreases.
The two lines intersect at (0, 4).
Important conclusion
Two functions can share an x-intercept or y-intercept without having the same shape, gradient, or overall behaviour.
Intercepts are useful comparison points, but they do not describe an entire graph.
How Transformations Affect Intercepts
Graph transformations often change the intercepts of functions.
Vertical translation
Consider:
y = x² − 4
Its x-intercepts are:
(−2, 0) and (2, 0)
Its y-intercept is:
(0, −4)
Translate the graph upward by 4:
y = x²
The x-intercepts combine into one:
(0, 0)
The y-intercept becomes:
(0, 0)
Reflection across the x-axis
Consider:
y = x² − 4
Reflect across the x-axis:
y = −x² + 4
The x-intercepts remain:
(−2, 0) and (2, 0)
The y-intercept changes from:
(0, −4) to (0, 4)
This happens because reflection across the x-axis preserves points on the x-axis but reverses the signs of other y-coordinates.
Reflection across the y-axis
Consider:
y = (x − 3)² − 1
The x-intercepts are:
(2, 0) and (4, 0)
Reflect across the y-axis:
y = (x + 3)² − 1
The x-intercepts become:
(−2, 0) and (−4, 0)
The y-intercept remains unchanged.
This is because points on the y-axis remain fixed during reflection across the y-axis.
When Intercepts Do Not Exist
Not every function has an x-intercept or a y-intercept.
For example:
y = 2ˣ
This function has a y-intercept at (0, 1), but no x-intercept because 2ˣ is always positive.
y = 1/x
This function has neither an x-intercept nor a y-intercept.
It never equals zero, and it is undefined at x = 0.
x = 5
This vertical line has an x-intercept at (5, 0), but no y-intercept.
These examples demonstrate why intercepts must be determined from the actual function rather than assumed.
Common Mistakes
Confusing x-intercepts and y-intercepts
For x-intercepts, set y = 0.
For y-intercepts, set x = 0.
Writing only the intercept value
An intercept is a point, so write coordinates such as (3, 0), not simply 3.
Assuming every graph has two intercepts
Some graphs have no x-intercepts, while others have multiple x-intercepts.
Confusing roots with y-intercepts
Roots or zeros of a function are the x-values where f(x) = 0.
Ignoring domain restrictions
An algebraic solution may lie outside the permitted domain of the function or the practical domain of a real-world model.
Assuming an x-intercept always represents a break-even point
This interpretation is appropriate for certain profit models, but not every function.
Reading graph scales incorrectly
Check whether each grid interval represents 1, 2, 5, 10, or another quantity.
Assuming an estimated intercept is exact
Use an approximation sign when reading a value from a graph.
Dividing by zero when using formulas
The formula x = −c/m for a straight line applies only when m ≠ 0.
Assuming a graph must cross an axis at an intercept
A graph can touch an axis without crossing it, as happens at the vertex of y = (x − 2)².
Key Terms
-
Intercept: A point where a graph meets a coordinate axis.
-
x-intercept: A point where the graph meets the x-axis and y = 0.
-
y-intercept: A point where the graph meets the y-axis and x = 0.
-
Root: An input value that makes a function equal zero.
-
Zero of a function: An x-value satisfying f(x) = 0.
-
Solution: A value satisfying an equation.
-
Coordinate: A number specifying a point's position on an axis.
-
Origin: The point (0, 0), where the coordinate axes intersect.
-
Gradient: The rate of change of a straight-line graph.
-
Linear function: A function whose graph is a straight line.
-
Quadratic function: A function containing a squared variable as its highest power.
-
Parabola: The U-shaped or inverted U-shaped graph of a quadratic function.
-
Discriminant: The expression b² − 4ac used to determine the number of real roots of a quadratic equation.
-
Break-even point: The point where revenue equals cost and profit is zero.
-
Initial value: The value of a quantity when the input is zero.
-
Domain: The set of permitted input values.
-
Range: The set of possible output values.
-
Graph estimation: Approximating values by reading a plotted graph.
Key Takeaways
-
An x-intercept occurs where y = 0.
-
A y-intercept occurs where x = 0.
-
To find x-intercepts, solve f(x) = 0.
-
To find the y-intercept, calculate f(0), provided zero is in the domain.
-
The x-intercepts of a function correspond to its real roots or zeros.
-
A linear function may have one x-intercept, no x-intercept, or infinitely many points on the x-axis.
-
A quadratic function can have zero, one, or two distinct x-intercepts.
-
The discriminant helps determine how many x-intercepts a quadratic has.
-
Intercepts can be estimated from graphs or calculated algebraically.
-
In real-world models, intercepts often represent starting values, break-even points, or times when a quantity reaches zero.
-
Domain restrictions determine which intercepts are meaningful.
-
Comparing intercepts helps us understand similarities and differences between functions.
Check Your Understanding
Recall and Understanding
1. Define an x-intercept and explain how to identify one on a graph.
2. Define a y-intercept and explain how to calculate it from an equation.
3. Explain the relationship between x-intercepts and the roots of a function.
4. Can a quadratic function have no x-intercepts? Explain using an example.
Application
5. Find both intercepts of y = 4x − 12.
6. Find both intercepts of y = −3x + 9.
7. Find all intercepts of y = x² − 7x + 12.
8. Determine the number of x-intercepts of y = 2x² + 4x + 5 using the discriminant.
9. Find the intercepts of y = |x − 4| − 3.
10. A tank contains 360 litres of water and drains at 15 litres per minute. Write a volume-time equation and interpret both intercepts.
Analysis and Challenge
11. A company's profit is modeled by P(x) = 40x − 1600. Find the break-even point and explain its meaning.
12. Find the intercepts of y = (x − 2)² − 9. Explain why the graph has two x-intercepts.
13. Compare the intercepts of y = 2x + 6 and y = 2x − 4. What do the intercepts tell you about the graphs?
14. A ball's height is modeled by h(t) = −5t² + 15t + 20. Find the initial height and determine when it reaches the ground.
15. A student claims that y = 3ˣ has an x-intercept at (0, 1). Explain the error and identify the correct intercept.
Answers to Check Your Understanding
1. An x-intercept is a point where a graph meets the x-axis. Its y-coordinate is zero. It can be identified by locating where the graph crosses or touches the x-axis.
2. A y-intercept is a point where a graph meets the y-axis. Substitute x = 0 into the equation to calculate it.
3. Roots or zeros are the x-values that make f(x) = 0. Each real root in the domain corresponds to an x-intercept (x, 0).
4. Yes. For example, y = x² + 4 has no x-intercepts because x² + 4 is always positive for real x.
5.
y = 4x − 12
x-intercept:
0 = 4x − 12
x = 3
(3, 0)
y-intercept:
x = 0
y = −12
(0, −12)
6.
y = −3x + 9
x-intercept:
0 = −3x + 9
x = 3
(3, 0)
y-intercept:
(0, 9)
7.
y = x² − 7x + 12
For x-intercepts:
0 = (x − 3)(x − 4)
x = 3 or x = 4
(3, 0) and (4, 0)
For the y-intercept:
x = 0
y = 12
(0, 12)
8.
a = 2, b = 4, c = 5
D = b² − 4ac
D = 16 − 40
D = −24
Since D is negative, the graph has no x-intercepts.
9.
y = |x − 4| − 3
For x-intercepts:
0 = |x − 4| − 3
|x − 4| = 3
x − 4 = 3 or x − 4 = −3
x = 7 or x = 1
x-intercepts: (1, 0) and (7, 0)
For the y-intercept:
y = |0 − 4| − 3 = 1
y-intercept: (0, 1)
10.
Volume equation:
V(t) = 360 − 15t
y-intercept:
(0, 360)
The tank initially contains 360 litres.
x-intercept:
0 = 360 − 15t
t = 24
(24, 0)
The tank becomes empty after 24 minutes.
11.
P(x) = 40x − 1600
Set P(x) = 0:
0 = 40x − 1600
40x = 1600
x = 40
Break-even point: (40, 0)
The company must sell 40 products to cover its costs under this model.
12.
y = (x − 2)² − 9
For x-intercepts:
0 = (x − 2)² − 9
(x − 2)² = 9
x − 2 = ±3
x = 5 or x = −1
x-intercepts: (−1, 0) and (5, 0)
For the y-intercept:
y = (0 − 2)² − 9
y = −5
y-intercept: (0, −5)
The parabola opens upward and its vertex (2, −9) is below the x-axis, so it crosses the x-axis at two points.
13.
First function:
y = 2x + 6
x-intercept: (−3, 0)
y-intercept: (0, 6)
Second function:
y = 2x − 4
x-intercept: (2, 0)
y-intercept: (0, −4)
Both lines have gradient 2, so they are parallel.
The second graph is a vertical translation of the first downward by 10 units.
14.
h(t) = −5t² + 15t + 20
Initial height:
h(0) = 20
Initial height = 20 m
For the landing time:
0 = −5t² + 15t + 20
Divide by −5:
0 = t² − 3t − 4
Factor:
0 = (t − 4)(t + 1)
t = 4 or t = −1
The physically meaningful time is:
t = 4 seconds
15.
The student has confused the x-intercept with the y-intercept.
For y = 3ˣ:
At x = 0:
y = 3⁰ = 1
Therefore:
y-intercept = (0, 1)
Since 3ˣ is always positive for real x, it never equals zero.
Therefore, the function has no x-intercept.
Final Summary
Intercepts are essential features of graphs because they show where mathematical relationships meet the coordinate axes.
The two most important rules are:
x-intercepts: Set y = 0 and solve for x.
y-intercepts: Set x = 0 and solve for y.
By calculating, estimating, interpreting, and comparing intercepts, we can understand important characteristics of functions and connect mathematical graphs to real-world situations.
Intercepts provide a foundation for solving equations, sketching graphs, analyzing functions, and building mathematical models.