Introduction to Chemical Equilibrium
4. Equilibrium Diagrams and Graphs
Learning outcomes
- I can interpret concentration-time graphs.
- I can identify equilibrium points on graphs.
- I can describe how concentrations change before equilibrium.
- I can analyze graphical representations of equilibrium.
- I can use graphs to explain equilibrium behavior.
Why Do We Use Equilibrium Graphs?
Chemical equilibrium happens at the particle level, so we cannot usually see individual forward and reverse reactions taking place.
Instead, scientists measure quantities such as:
- concentration
- reaction rate
- pressure
- time
and represent the results using graphs.
One of the most useful is a concentration-time graph.
A concentration-time graph shows how the concentrations of reactants and products change as a reversible reaction approaches equilibrium.
For example:
A ⇌ B
At the beginning, there may be a high concentration of A and little or no B.
As the reaction proceeds:
- A is converted into B
- the concentration of A decreases
- the concentration of B increases
Eventually, both concentrations become constant.
That is evidence that the system has reached dynamic equilibrium.
Understanding the Axes
Before interpreting any graph, identify the axes.
On a typical concentration-time graph:
Horizontal axis
Time
This might be measured in:
- seconds
- minutes
- hours
Vertical axis
Concentration
This might be measured in:
mol/dm³
or:
mol/L
So the graph answers the question:
How does the concentration of each substance change over time?
A Typical Concentration-Time Graph
Consider:
A ⇌ B
Suppose we begin mainly with A.
An illustrative set of data might look like this:
| Time | [A] (mol/dm³) | [B] (mol/dm³) |
|---|---|---|
| 0 | 1.00 | 0.00 |
| 1 | 0.75 | 0.25 |
| 2 | 0.62 | 0.38 |
| 3 | 0.55 | 0.45 |
| 4 | 0.51 | 0.49 |
| 5 | 0.50 | 0.50 |
| 6 | 0.50 | 0.50 |
| 7 | 0.50 | 0.50 |
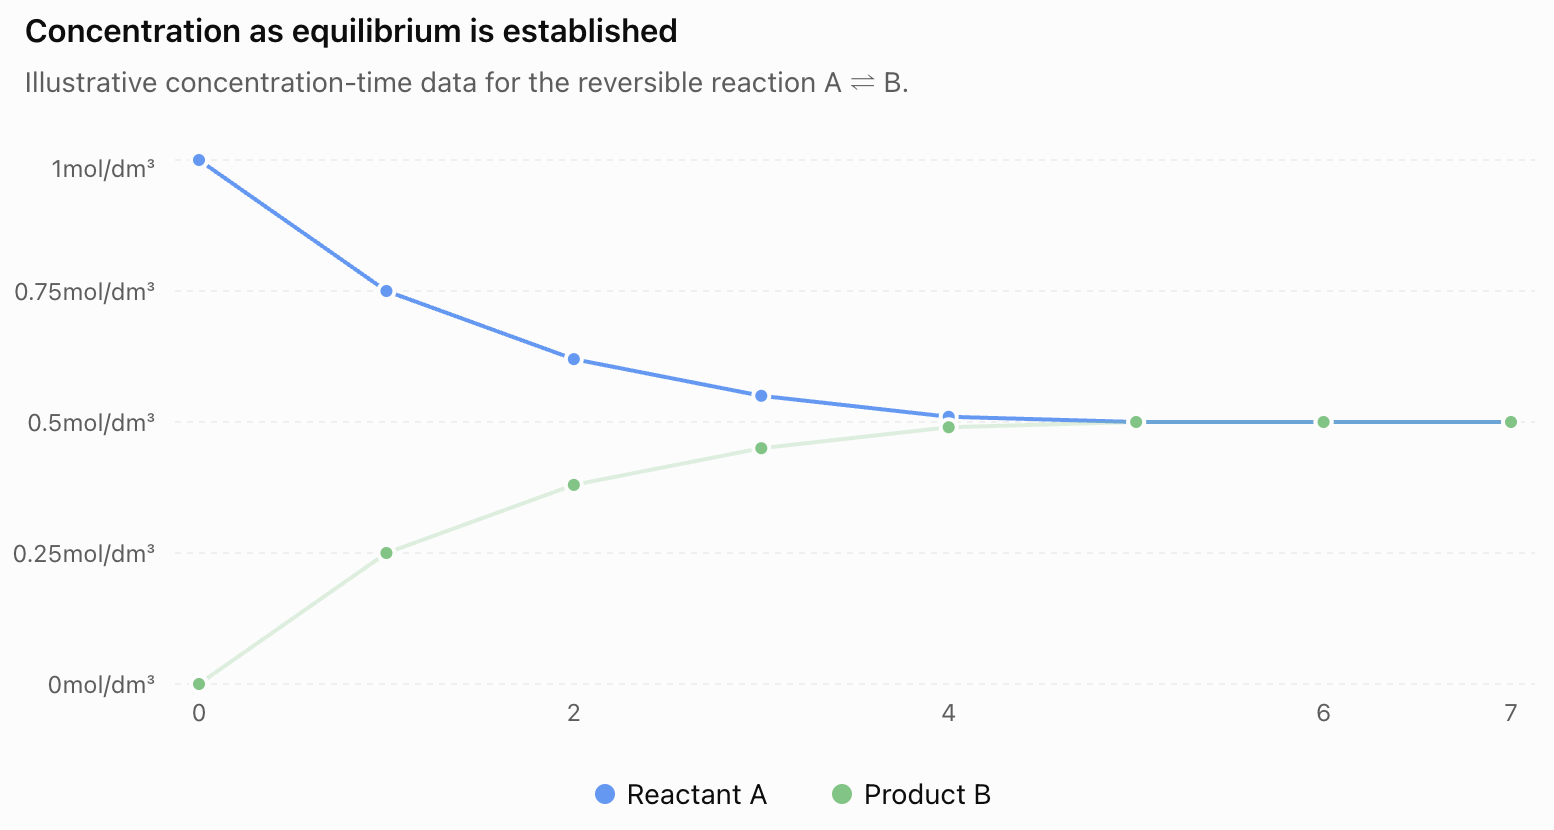
Before equilibrium:
- [A] decreases
- [B] increases
From about 5 time units onward, both concentrations remain constant.
This indicates that equilibrium has been established.
What Does [A] Mean?
Chemists commonly use square brackets to represent concentration.
For example:
[A]
means:
the concentration of A
Similarly:
[H₂]
means:
the concentration of hydrogen
and:
[NH₃]
means:
the concentration of ammonia
Therefore, a graph labelled [A] against time is showing how the concentration of A changes over time.
Before Equilibrium
Before equilibrium is established, there is a net change in concentrations.
Consider:
A ⇌ B
If the reaction begins mainly with A:
[A] decreases
while:
[B] increases
Why?
Initially, the forward reaction occurs faster than the reverse reaction.
So:
forward rate > reverse rate
More A is being converted into B than B is being converted back into A.
Why Does the Reactant Curve Become Less Steep?
At the beginning, the reactant concentration may decrease quickly.
Later, the curve becomes less steep.
A steep curve means the concentration is changing rapidly.
A flatter curve means the concentration is changing more slowly.
As equilibrium approaches, the net change becomes smaller because the forward and reverse reaction rates are becoming closer.
Eventually, the concentration curve becomes horizontal.
Identifying the Equilibrium Point
On a concentration-time graph, equilibrium is reached when the concentrations become constant.
Look for the point where the curves:
level off and become horizontal
This does not mean the concentrations have become zero.
It does not mean the reactant and product concentrations have become equal.
It means their concentrations are no longer changing overall.
At this point:
rate of forward reaction = rate of reverse reaction
Equilibrium Does Not Mean Equal Concentrations
Suppose another reaction reaches the following equilibrium concentrations:
[A] = 0.70 mol/dm³
[B] = 0.30 mol/dm³
The concentrations are clearly not equal.
The system can still be at equilibrium.
Consider this illustrative graph:
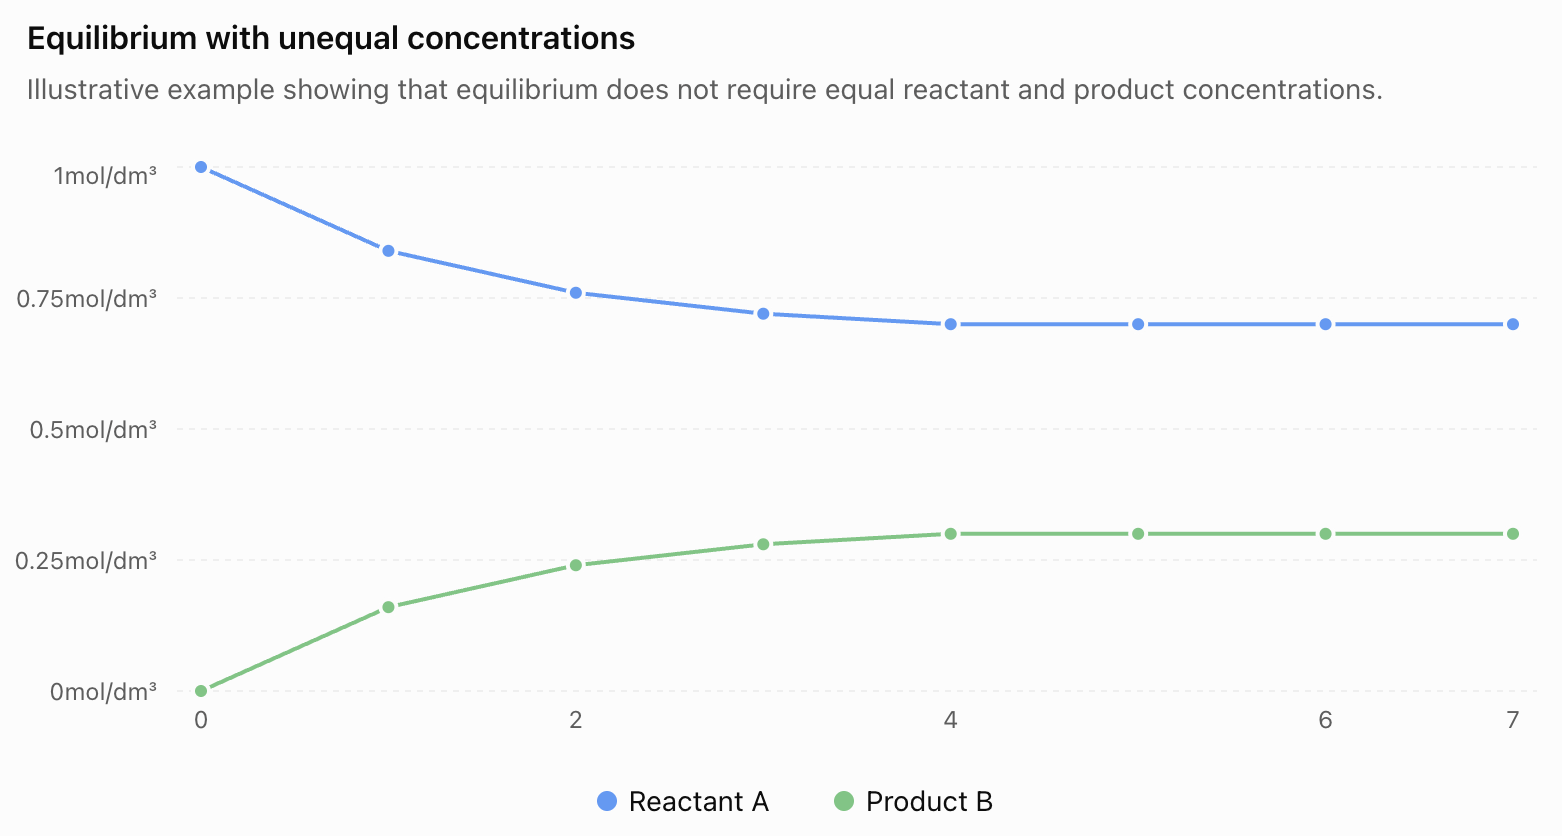
The important observation is that both curves become horizontal.
At equilibrium:
concentrations are constant
not necessarily:
concentrations are equal
What Does a Horizontal Line Mean?
A horizontal section of a concentration-time graph means:
concentration is not changing with time
For an equilibrium system, this means that there is no net change in the amount of that substance.
However, particles are still reacting.
Suppose:
A ⇌ B
At equilibrium:
A → B
continues, and:
B → A
continues.
Because the rates are equal, [A] and [B] remain constant.
Constant Concentration Does Not Mean the Reaction Has Stopped
This is one of the most important ideas when interpreting equilibrium graphs.
If a concentration curve becomes horizontal, it is tempting to conclude:
"The reaction has stopped."
That is incorrect.
At dynamic equilibrium, reactions continue in both directions.
At the particle level:
- particles continue moving
- collisions continue
- bonds continue breaking
- bonds continue forming
- reactants continue becoming products
- products continue becoming reactants
The graph is horizontal because the two opposing reactions produce no net change in concentration.
Concentration Graphs vs Rate Graphs
Students sometimes confuse concentration-time graphs with reaction-rate graphs.
They show different things.
Concentration-time graph
Shows:
how much of each substance is present per unit volume
Rate-time graph
Shows:
how quickly the forward and reverse reactions are occurring
The graphs are related, but they should not be interpreted in exactly the same way.
Reaction-Rate Graphs
Suppose a reversible reaction begins mainly with reactants.
Initially:
- forward rate is high
- reverse rate is low
As products accumulate:
- forward rate decreases
- reverse rate increases
Eventually:
forward rate = reverse rate
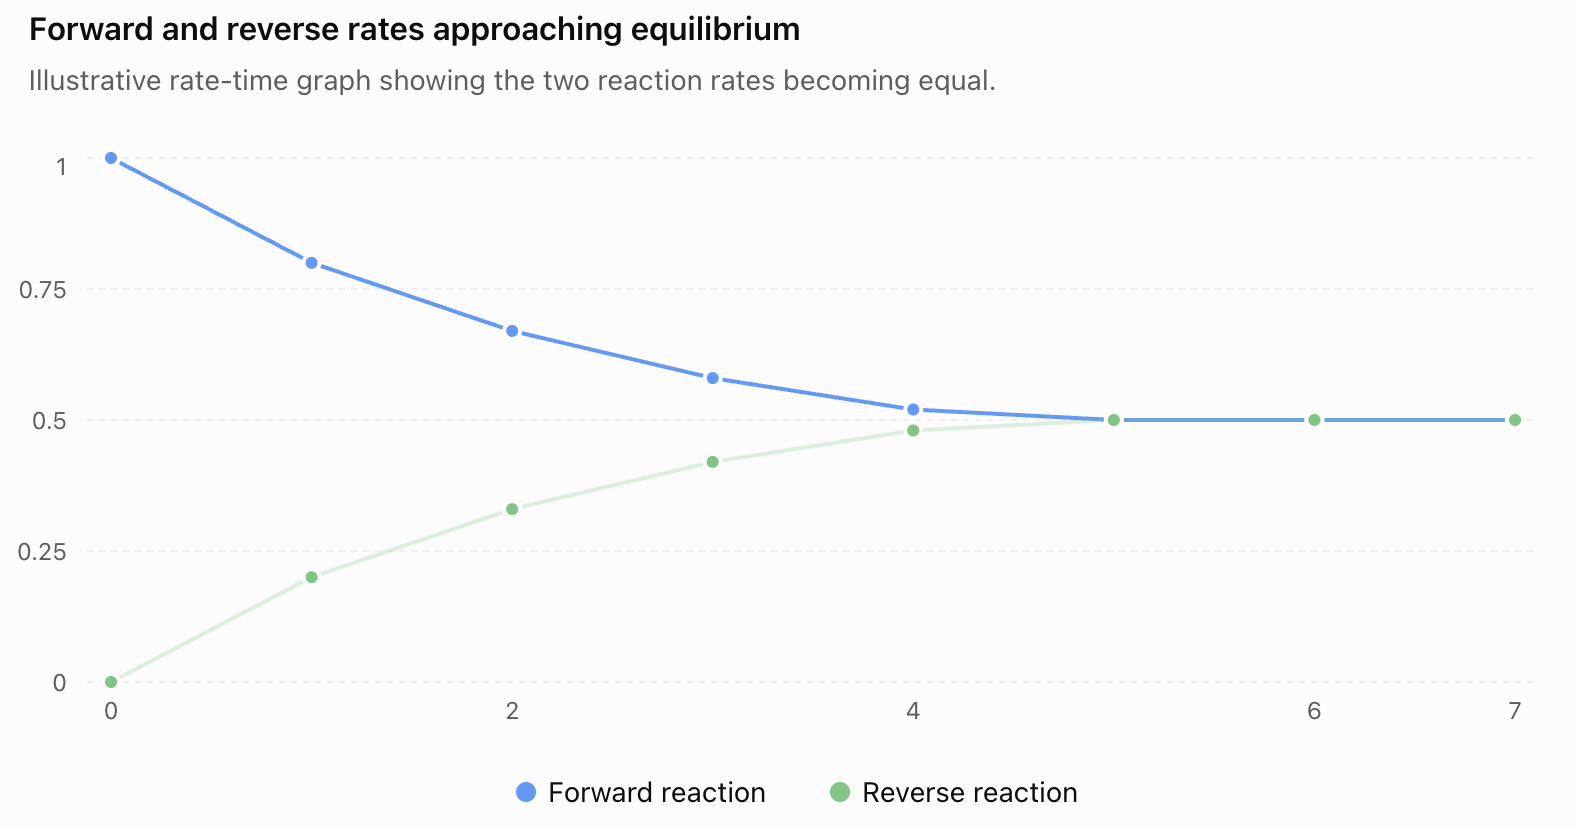
On this type of graph, equilibrium is reached when the two reaction-rate curves become equal.
This is different from a concentration graph, where the curves do not need to meet.
Comparing the Two Types of Graph
| Concentration-Time Graph | Rate-Time Graph |
|---|---|
| Shows concentration | Shows reaction rate |
| Curves become horizontal at equilibrium | Forward and reverse rates become equal |
| Reactant and product curves do not need to meet | Forward and reverse rate curves meet |
| Constant concentration indicates no net change | Equal rates explain why concentration is constant |
This distinction is extremely useful when interpreting equilibrium diagrams.
Worked Example 1: Finding the Equilibrium Time
Suppose a graph shows:
| Time (s) | [A] (mol/dm³) | [B] (mol/dm³) |
|---|---|---|
| 0 | 0.90 | 0.10 |
| 10 | 0.70 | 0.30 |
| 20 | 0.60 | 0.40 |
| 30 | 0.55 | 0.45 |
| 40 | 0.55 | 0.45 |
| 50 | 0.55 | 0.45 |
When is equilibrium established?
At 30 s, the concentrations reach:
[A] = 0.55 mol/dm³
[B] = 0.45 mol/dm³
After this point, both remain constant.
Answer
Equilibrium is established at approximately 30 s.
Worked Example 2: Interpreting Unequal Concentrations
At equilibrium, a graph shows:
[X] = 0.80 mol/dm³
[Y] = 0.20 mol/dm³
A student says:
"The reaction is not at equilibrium because X and Y have different concentrations."
The student is incorrect.
Equilibrium requires:
forward rate = reverse rate
It does not require:
[X] = [Y]
The horizontal concentration curves indicate that both concentrations are constant.
Worked Example 3: What Happens Before Equilibrium?
Consider:
A ⇌ B
A graph shows that [A] is decreasing while [B] is increasing.
What can we conclude?
There is a net forward reaction.
This means:
forward rate > reverse rate
Both reactions may already be occurring, but the forward reaction is occurring faster overall.
Worked Example 4: Reading the Shape of a Curve
Suppose [A] falls very rapidly during the first 10 seconds and then decreases more slowly between 10 and 30 seconds.
This means:
First 10 seconds
The net change in concentration is large.
10–30 seconds
The net change becomes smaller.
After 30 seconds
The graph becomes horizontal.
The system has reached equilibrium.
This graphical pattern represents the system gradually approaching dynamic equilibrium.
Starting with Products Instead
A reversible reaction does not have to begin with reactants.
Consider:
A ⇌ B
Suppose we begin with mostly B.
Then:
- [B] may decrease
- [A] may increase
Eventually, both concentrations become constant.
The direction in which the concentrations initially change depends on the starting composition.
The important feature is that the system eventually approaches constant equilibrium concentrations.
Several Substances on One Graph
Real reversible reactions often involve more than two substances.
For example:
N₂(g) + 3H₂(g) ⇌ 2NH₃(g)
A concentration-time graph could contain three curves:
- [N₂]
- [H₂]
- [NH₃]
If the system begins with nitrogen and hydrogen:
- [N₂] decreases
- [H₂] decreases
- [NH₃] increases
Eventually, all three curves level off.
That indicates equilibrium.
Again, the concentrations do not need to become equal.
The Shape Can Tell Us About Stoichiometry
Consider:
N₂ + 3H₂ ⇌ 2NH₃
The coefficients tell us that substances are consumed and produced in specific mole ratios.
For every:
1 mol N₂ consumed
approximately:
3 mol H₂ are consumed
and:
2 mol NH₃ are produced
Therefore, changes in concentration can reflect the stoichiometric relationship in the balanced equation, provided the volume is constant.
This means equilibrium graphs can contain information not only about equilibrium but also about the reaction equation itself.
Equilibrium Points on Graphs
The phrase equilibrium point usually refers to the time when the system first reaches equilibrium.
On a concentration-time graph, look for the time when:
all concentration curves become constant
On a rate-time graph, look for the time when:
forward rate = reverse rate
After that point, the system remains at equilibrium as long as the conditions remain unchanged.
What Happens If Equilibrium Is Disturbed?
Suppose a system reaches equilibrium.
Its concentration curves are horizontal.
Then something changes.
For example:
- reactant is added
- product is removed
- volume changes
- pressure changes
- temperature changes
The graph may begin changing again.
Eventually, the system may establish a new equilibrium.
The concentrations then become constant again, although they may have different values from before.
A Graph with Two Equilibria
Consider an illustrative reaction:
A ⇌ B
Initially, the system reaches equilibrium.
Later, the conditions are changed.
The system then moves toward a new equilibrium.