Decimals and Percentages
5. Real-World Percentages
Learning outcomes
- I can interpret percentages in advertisements and media.
- I can calculate discounts, taxes, and tips.
- I can compare percentage-based offers.
- I can analyze data presented as percentages.
- I can explain how percentages are used in everyday life.


Percentages Are Everywhere
Percentages are one of the most common ways of communicating numerical information.
We encounter them in:
- advertisements and sales
- taxes
- restaurant tips
- test results
- surveys and polls
- sports statistics
- financial interest
- product labels
- population data
- scientific reports
- battery indicators
- weather information
A percentage allows us to describe a quantity relative to 100.
For example:
35% = 35/100 = 0.35
Understanding percentages is important, but real-world situations also require us to interpret what the percentage actually means.
Interpreting Percentages in Advertisements
Advertisements frequently use percentages to make offers easy to notice.
You might see:
20% OFF
SAVE 50%
30% MORE
15% BONUS
These statements describe a change relative to some original or reference quantity.


For example:
20% off $80
means the discount is:
20% of $80
Calculate:
0.20 × 80 = $16
The new price is:
$80 − $16 = $64
Discount Amount vs Sale Price
These two quantities should not be confused.
Suppose an item costs $120 and has a 25% discount.
Discount amount:
0.25 × $120 = $30
Sale price:
$120 − $30 = $90
Therefore:
Discount = $30
Final price = $90
The advertisement tells you the percentage reduction, not necessarily the amount you will actually pay.
Using a Percentage Multiplier
A discount can also be calculated in one step.
If an item is:
25% off
then:
100% − 25% = 75%
of the original price remains.
Convert:
75% = 0.75
Then:
sale price = original price × 0.75
For a $120 item:
$120 × 0.75 = $90


Advertisements Need Context
Consider an advertisement saying:
SAVE 40%!
This sounds impressive, but we still need more information.
We should ask:
- 40% of what price?
- Is the discount applied to the regular price?
- Are there additional fees?
- Is the offer limited to certain products?
- Is another offer available?
- Are multiple discounts applied separately?
- Is tax added afterward?
Good mathematical thinking involves understanding both the number and its context.
Comparing Discounts
Suppose two stores sell the same $100 item.
Store A offers:
20% off
Store B offers:
$15 off
Store A:
20% of $100 = $20
Final price:
$80
Store B:
$100 − $15 = $85
For this particular $100 item, the 20% discount produces the lower final price.
But the comparison can change if the original price changes.
Comparing Percentage and Fixed Discounts
Suppose an advertisement offers either:
20% off
or:
$20 off
When are they equal?
Let the original price be $100.
20% of $100:
0.20 × 100 = $20
Therefore, the offers are equal at:
$100
If the price is greater than $100, 20% off saves more than $20.
If the price is less than $100, $20 off saves more than 20%, provided the offer is valid for that price.
This shows why percentage offers should be evaluated using the actual quantity involved.
Successive Discounts
Advertisements sometimes offer more than one discount.
Suppose an item costs:
$200
The store offers:
30% off
followed by:
an additional 10% off
It may be tempting to say:
30% + 10% = 40% off
But that is not correct.
First discount:
$200 × 0.70 = $140
Second discount:
$140 × 0.90 = $126
Final price:
$126
Total reduction:
$200 − $126 = $74
Percentage reduction:
74/200 × 100% = 37%
The combined discount is:
37%
not 40%.


Why Successive Discounts Do Not Simply Add
The first percentage is calculated from the original price.
The second percentage is calculated from the new, lower price.
That means the two percentages have different reference quantities.
This is an important idea whenever percentage changes occur one after another.
Taxes
Many purchases have taxes added to the listed price.
Suppose an item costs:
$80
and a hypothetical sales tax of:
9%
is added.
Tax:
0.09 × $80 = $7.20
Total cost:
$80 + $7.20 = $87.20
The tax is calculated as a percentage of the taxable amount.
Calculating Tax with a Multiplier
If 9% tax is added:
100% + 9% = 109%
Convert:
109% = 1.09
Therefore:
total = original price × 1.09
For the previous example:
$80 × 1.09 = $87.20
This gives the total directly.


Actual tax rules and rates vary by jurisdiction and by the type of product or service, so real purchases may require additional information.
Tips
A tip is an additional amount sometimes added to a bill for service.
Suppose a restaurant bill is:
$60
and you decide to leave:
15%
as a tip.
Calculate:
0.15 × $60 = $9
Total:
$60 + $9 = $69
Therefore:
Tip = $9
Total = $69
Estimating a Tip
Exact calculations are not always necessary.
Suppose a bill is:
$48
and you want to estimate a 20% tip.
10% of $48:
$4.80
Therefore:
20%:
$9.60
You might use this exact amount or round appropriately depending on the situation.
Mental Calculation of Tips
Benchmark percentages make mental calculations easier.
For a $70 bill:
10% = $7
20% = $14
5% = $3.50
Therefore:
15% = $7 + $3.50 = $10.50


Taxes and Tips Together
Suppose a meal costs:
$50
A hypothetical 8% tax is added.
Tax:
0.08 × $50 = $4
Subtotal:
$54
If a 20% tip is calculated from the $50 pre-tax meal price:
0.20 × $50 = $10
Total:
$64
However, real situations may calculate tips or service charges differently. Always identify the quantity to which the percentage applies.
The Reference Quantity Matters
Consider:
20% of $50
and:
20% of $100
The percentage is the same.
But:
20% of $50 = $10
while:
20% of $100 = $20
The percentage alone does not tell us the actual amount.
We must know the reference quantity, sometimes called the base or whole.
Comparing Percentage-Based Offers
Suppose two stores sell the same item for different prices.
Store A:
Original price = $80
Discount = 25%
Store B:
Original price = $70
Discount = 15%
Store A:
$80 × 0.75 = $60
Store B:
$70 × 0.85 = $59.50
The larger percentage discount does not automatically produce the lower final price.
You must consider both:
original price + percentage discount


"Extra Free" Offers
Suppose one package normally contains:
500 g
An advertisement says:
20% extra free
Find 20%:
0.20 × 500 g = 100 g
New quantity:
500 g + 100 g = 600 g
So the package contains:
600 g
This is a percentage increase in quantity rather than a percentage decrease in price.
Comparing "20% Extra" and "20% Off"
These statements are not mathematically identical.
Suppose a product normally costs $10 for 100 units.
With 20% extra, you receive:
120 units for $10
With 20% off, you receive:
100 units for $8
To compare them fairly, calculate something like:
cost per unit
This illustrates an important principle:
Different percentage offers may require conversion to a common measure before they can be compared.
Unit Price
Suppose:
Package A:
500 g for $4.00
Package B:
750 g for $5.25
To compare value, calculate price per 100 g.
Package A:
$4.00 ÷ 5 = $0.80 per 100 g
Package B:
$5.25 ÷ 7.5 = $0.70 per 100 g
Package B has the lower unit price.
Percentage claims are useful, but unit-price comparisons can provide additional information.
Percentages in Media
News reports and media frequently use percentages to summarize data.
Examples might include statements such as:
"62% of respondents selected option A."
"Sales increased by 18%."
"Attendance fell by 12%."
"40% of participants reported using the service."


To interpret these statements properly, we need to understand what was measured.
Ask: Percentage of What?
Whenever you see a percentage in media or advertising, ask:
Percentage of what?
Suppose a headline says:
"Risk increased by 50%."
That statement does not tell us the original risk.
For example, an increase from:
2 in 1,000
to:
3 in 1,000
is a 50% relative increase because:
(3 − 2) / 2 × 100% = 50%
But the absolute increase is:
1 additional case per 1,000
Both pieces of information can help explain the change.
Percentage Change vs Percentage Points
This distinction is particularly important when interpreting data.
Suppose a survey result increases from:
40% to 50%
The increase is:
10 percentage points
But the percentage increase relative to the original 40% is:
(50 − 40) / 40 × 100%
= 25%
Therefore:
40% → 50%
is:
an increase of 10 percentage points
and:
a 25% relative increase
These statements describe different calculations.
Why Percentage Points Matter
Suppose an interest rate changes from:
3% to 4%
The difference is:
1 percentage point
But relative to the original rate:
(4 − 3) / 3 × 100% ≈ 33.3%
So saying "increased by 1%" can be ambiguous.
Clear communication distinguishes:
percentage-point change
from:
percentage change
Percentages in Surveys
Suppose a survey reports:
60% prefer A
25% prefer B
15% prefer C
These percentages add to:
100%
They can be represented as parts of a whole.
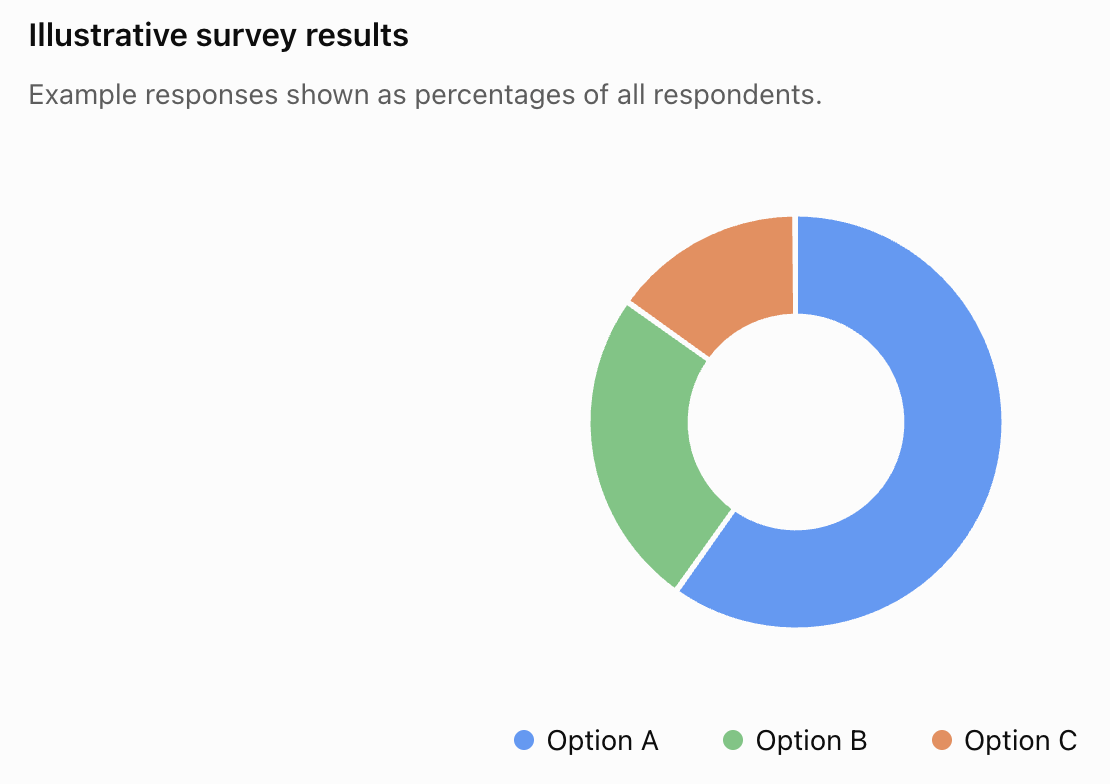
But percentages alone do not tell us everything about a survey.
We should also consider:
- number of participants
- who was surveyed
- how participants were selected
- wording of the question
- whether people could choose more than one answer
- when the survey was conducted
Mathematical interpretation includes understanding how the data were produced.
Sample Size Matters
Consider two surveys.
Survey A:
9 of 10 people agree.
Percentage:
90%
Survey B:
850 of 1,000 people agree.
Percentage:
85%
Survey A has the higher percentage, but it is based on only 10 people.
This does not make the 90% calculation incorrect. It means the context and amount of evidence differ.
Percentages Can Hide the Actual Numbers
Suppose a report says:
"Complaints increased by 100%."
That sounds like a very large increase.
But suppose complaints increased from:
1 complaint to 2 complaints
The increase really is 100%:
(2 − 1) / 1 × 100% = 100%
However, knowing the actual numbers gives important context.


Percentages and Graphs
Percentages are frequently displayed in:
- bar graphs
- pie charts
- line graphs
- tables
- infographics
Suppose a graph reports:
Class A: 65%
Class B: 72%
Class C: 80%
Class D: 85%
Illustrative class results
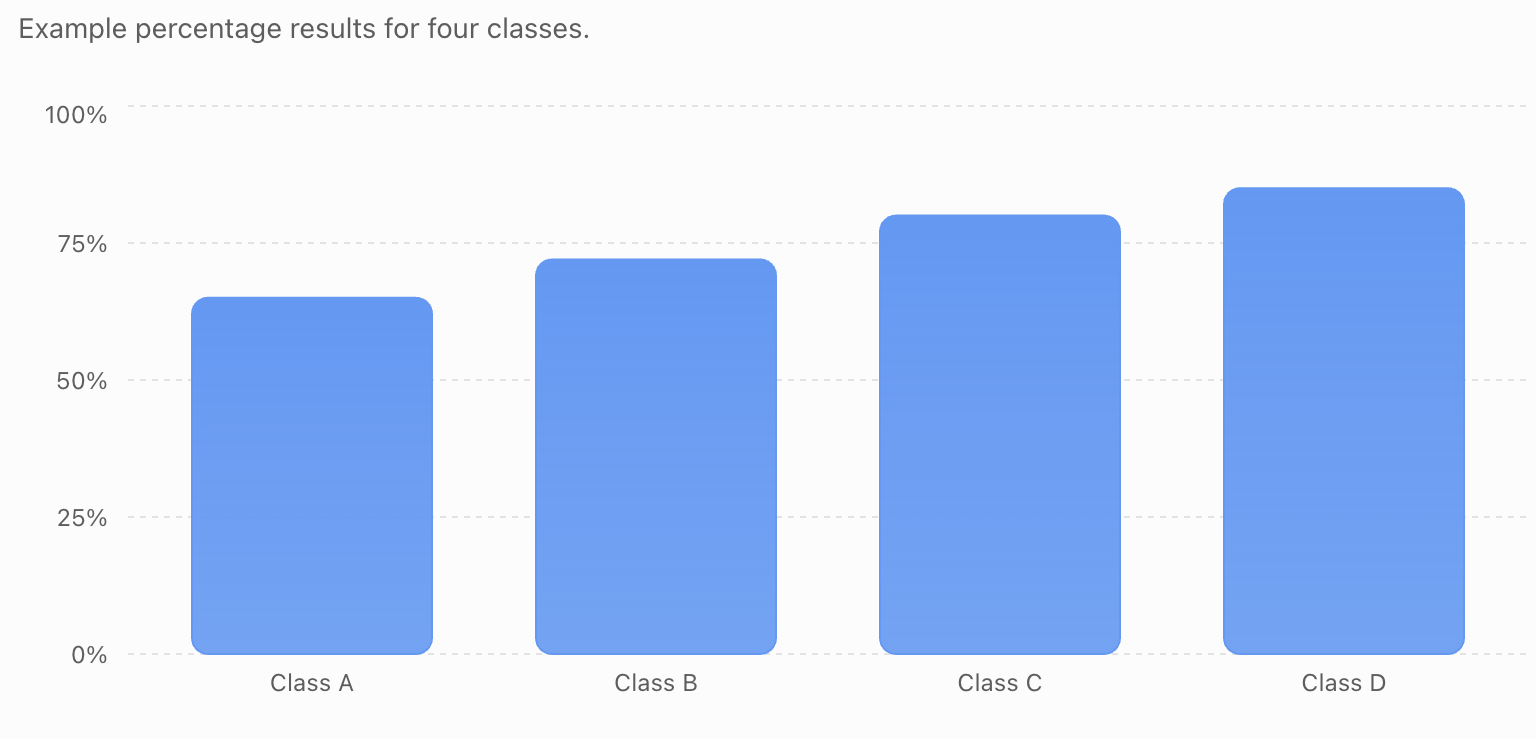
The percentages can be compared directly because they use the same scale.
Be Careful with Graph Scales
The design of a graph can influence how large differences appear.
Imagine two values:
78% and 82%
On a graph running from 0% to 100%, the difference appears fairly small.
If the graph begins at 75%, the visual difference may appear much larger.
The numerical difference remains:
4 percentage points
regardless of how the graph is displayed.
When interpreting graphs, always examine the axes and scale.
Percentages and Probability
Suppose a weather forecast gives an event a probability of:
30%
Mathematically:
30% = 0.30 = 3/10
This represents a probability, not a guarantee about what will happen in one particular instance.
Similarly:
70%
represents a higher probability than 30%, but it does not mean the event must occur.
Percentages in Product Labels
Product labels often contain percentages.
Examples include:
- nutrient percentages
- ingredient concentrations
- battery charge
- material composition
- efficiency ratings


Always identify what the percentage is measuring and what reference quantity it uses.
Percentages in Finance
Percentages are widely used to describe:
- interest rates
- investment returns
- fees
- taxes
- price changes
- inflation
- discounts
- commissions
For example, if $500 earns 4% simple interest over a stated one-year period:
4% of $500 = $20
The amount becomes:
$520
More advanced financial calculations may involve compound interest, where percentages are repeatedly applied to changing balances.
Percentages in Science
Scientists use percentages to describe:
- percentage error
- percentage yield
- concentration
- efficiency
- composition
- changes in measurements
- proportions within samples
For example:
If a machine receives 200 J of energy and produces 150 J of useful output:
efficiency = useful output / total input × 100%
= 150/200 × 100%
= 75%
Comparing Data Fairly
Suppose:
Team A wins 8 of 10 games.
Team B wins 30 of 40 games.
Team A:
8/10 = 80%
Team B:
30/40 = 75%
Percentages allow us to compare the teams proportionally despite the different numbers of games.
However, a complete analysis may also consider the number of games and other relevant factors.
Worked Example 1: Discount
A jacket costs $160 and is discounted by 30%.
Discount:
0.30 × 160 = $48
Sale price:
$160 − $48 = $112
Answer:
$112
Worked Example 2: Tax
A hypothetical 8% tax is added to a $75 purchase.
Tax:
0.08 × 75 = $6
Total:
$75 + $6 = $81
Answer:
$81
Worked Example 3: Tip
A restaurant bill is $84.
A customer chooses an 18% tip.
Tip:
0.18 × 84 = $15.12
Total:
$84 + $15.12 = $99.12
Worked Example 4: Comparing Offers
An $80 item has two possible offers:
Offer A:
30% off
Offer B:
$20 off
Offer A discount:
0.30 × 80 = $24
Final price:
$56
Offer B final price:
$60
For this $80 item, Offer A produces the lower final price.
Worked Example 5: Percentage Increase
A club grows from 200 members to 250 members.
Increase:
250 − 200 = 50
Percentage increase:
50/200 × 100% = 25%
Therefore:
membership increased by 25%.
Worked Example 6: Media Data
A report says participation decreased from 60% to 48%.
Percentage-point decrease:
60% − 48% = 12 percentage points
Relative percentage decrease:
12/60 × 100% = 20%
Therefore, these two descriptions are both mathematically meaningful:
a decrease of 12 percentage points
and:
a 20% decrease relative to the original percentage.
Worked Example 7: "Extra Free"
A cereal box normally contains:
400 g
A promotion provides:
25% extra
Extra cereal:
0.25 × 400 = 100 g
New quantity:
400 + 100 = 500 g
Therefore:
the promotional box contains 500 g.
Worked Example 8: Successive Changes
A $250 item is increased in price by 20% and later discounted by 20%.
After the increase:
$250 × 1.20 = $300
After the decrease:
$300 × 0.80 = $240
Final price:
$240
The price does not return to $250 because the two percentages are calculated from different reference amounts.
Checking Whether an Answer Is Reasonable
Before accepting a percentage calculation, estimate.
Suppose an item costs:
$198
and is discounted by:
31%
Estimate:
31% is close to 30%.
$198 is close to $200.
30% of $200:
$60
Therefore, the discount should be approximately $60.
If your calculation gives $6 or $600, something is probably wrong.


Questions to Ask About Percentage Claims
When you encounter a percentage in an advertisement, graph, article, or social-media post, ask:
- What is the percentage describing?
- What is the whole or reference quantity?
- What was the original value?
- What is the actual numerical change?
- Is this percentage change or percentage-point change?
- How large is the sample?
- What time period is being discussed?
- Are two percentages being compared using the same definition?
- Does the graph use an appropriate scale?
- Is important context missing?
These questions help turn percentage calculation into percentage literacy.
Common Mistakes
Mistake 1: Assuming the largest discount percentage always gives the lowest price
Original prices may differ.
Mistake 2: Adding successive discounts
20% off followed by 10% off is not generally 30% off.
Mistake 3: Confusing discount with final price
A $20 discount does not mean the item costs $20.
Mistake 4: Forgetting that tax is added
A 9% tax means:
original + 9% of original
not:
original − 9%
Mistake 5: Confusing percentage change with percentage points
An increase from 20% to 30% is:
10 percentage points
but:
50% relative increase
because:
10/20 × 100% = 50%
Mistake 6: Ignoring the original value
A 100% increase from 1 to 2 is very different in scale from a 100% increase from 10,000 to 20,000.
Mistake 7: Assuming a percentage tells the whole story
Sample size, starting values, definitions, and context may also matter.
Mistake 8: Trusting a graph without checking its scale
A shortened vertical axis can make a small percentage difference look visually dramatic.
Mistake 9: Comparing percentages that measure different things
Before comparing percentages, make sure their definitions and reference quantities are compatible.
Did You Know?
Percentages are powerful because they standardize quantities onto a common scale.


But this also means percentages can be misunderstood when the reference quantity is missing.
For example:
"Sales increased by 200%."
If sales originally were 10 units, a 200% increase means an increase of:
20 units
giving:
30 units total
The new value is 300% of the original, because the original 100% remains and another 200% has been added.
Understanding this distinction helps us interpret advertisements and media claims accurately.
Key Terms
- Percentage: Quantity expressed as parts per hundred.
- Reference quantity: Original or whole quantity to which a percentage refers.
- Discount: Reduction from an original price.
- Sale price: Price remaining after a discount.
- Tax: Amount charged according to an applicable tax rule or rate.
- Tip: Additional amount given for service.
- Markup: Amount added to the cost of a product.
- Unit price: Cost per standard unit of quantity.
- Percentage increase: Increase expressed relative to the original value.
- Percentage decrease: Decrease expressed relative to the original value.
- Percentage change: Change divided by the original value and expressed as a percentage.
- Percentage point: Difference between two percentage values.
- Successive percentage change: Two or more percentage changes applied one after another.
- Sample size: Number of observations or participants used to produce a statistic.
- Absolute change: Numerical difference between two quantities.
- Relative change: Change compared with the original quantity.
- Estimate: Approximate value used to predict or check an answer.
Useful Equations
Percentage amount:
percentage amount = percentage/100 × quantity
Discounted price:
sale price = original price − discount
or:
sale price = original price × percentage remaining
Price after tax:
total price = original price + tax
Percentage change:
percentage change = change/original value × 100%
Unit price:
unit price = total price/quantity
Real-World Percentage Strategy
When faced with a percentage in everyday life:
1. Identify the percentage.
2. Identify what the percentage is based on.
3. Determine the original or reference quantity.
4. Decide whether the percentage represents an amount, increase, decrease, discount, tax, tip, probability, or proportion.
5. Estimate what you expect.
6. Calculate.
7. Compare alternatives using the same basis.
8. Check the units and context.
9. Ask whether the result is reasonable.
10. Interpret what the number actually tells you.
Key Takeaways
- Percentages are widely used in advertisements, shopping, finance, statistics, science, surveys, and media.
- A percentage should always be interpreted relative to a reference quantity.
- Discounts reduce prices, while taxes, tips, and markups generally add amounts.
- The discount amount and final sale price are different quantities.
- Percentage multipliers can make real-world calculations faster.
- Different offers should be converted to comparable final prices or unit prices before being evaluated.
- Successive discounts and increases should be applied one after another.
- Percentage changes do not simply add when they use different reference quantities.
- The same percentage can represent very different actual amounts.
- A larger percentage discount does not necessarily mean a lower final price when original prices differ.
- Percentages make it easier to compare groups of different sizes, but sample size and context still matter.
- Percentage change and percentage-point change are different concepts.
- Graph scales can influence how percentage differences appear visually.
- Media percentage claims are easier to interpret when the original numbers are also known.
- Estimation is an effective way to check real-world percentage calculations.
- Good percentage reasoning requires more than calculation. It requires asking:
What does this percentage represent, what is it a percentage of, and does the comparison make sense?