Graphing and Data Analysis
4. Identifying relationships
Learning outcomes
- I can identify linear and non-linear relationships from graphs.
- I can recognize directly proportional relationships.
- I can recognize inverse relationships.
- I can determine mathematical relationships from graphical trends.
- I can explain the physical meaning of graph patterns.
Relationships Between Variables
Graphs allow us to see how one variable changes when another variable changes.
For example, we might investigate how:
- Distance changes with time.
- Temperature changes as an object is heated.
- Mass changes with volume.
- Pressure changes with volume.
- The extension of a spring changes with force.
When the data are plotted, the shape of the graph gives us information about the relationship between the variables.
Some common relationships are:
- Linear
- Directly proportional
- Inverse
- Other non-linear relationships
- No clear relationship
Recognizing these patterns allows us to describe and sometimes predict how a system behaves.
Linear Relationships
A linear relationship produces a straight-line graph.
A common form is:
where:
- m is the gradient.
- c is the y-intercept.
For example:
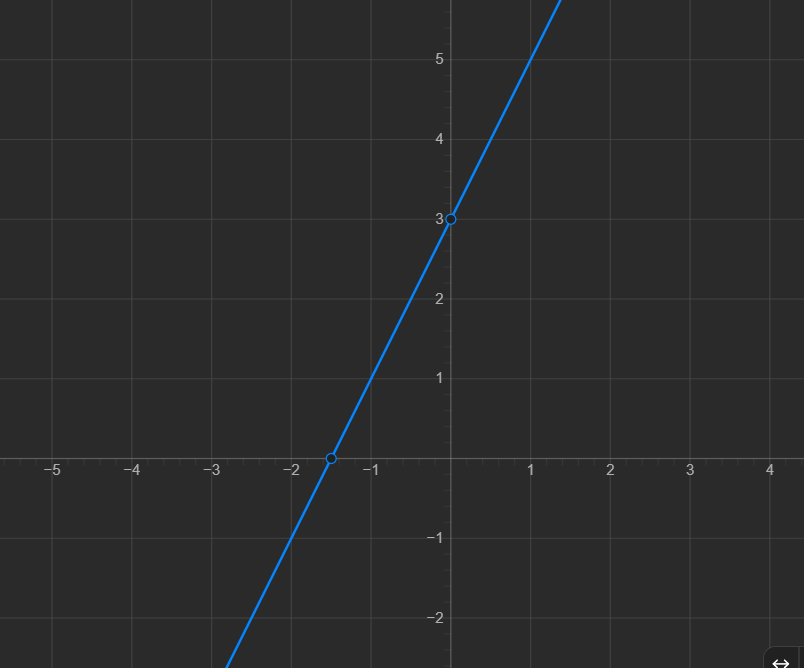
The graph is a straight line.
Every time x increases by 1, y increases by 2.
Therefore, the rate of change is constant.
Recognizing a Linear Relationship
A graph shows a linear relationship when:
- The points form approximately a straight line.
- The gradient is constant.
- Equal changes in x produce equal changes in y.
For example:
| x | y |
|---|---|
| 1 | 5 |
| 2 | 8 |
| 3 | 11 |
| 4 | 14 |
| 5 | 17 |
Each time x increases by 1:
This constant change tells us that the relationship is linear.
The equation is:
Positive and Negative Linear Relationships
Linear relationships can have positive or negative gradients.
Positive Linear Relationship
If y increases as x increases, the graph rises from left to right.
For example:
This has a positive gradient.
Negative Linear Relationship
If y decreases as x increases, the graph falls from left to right.
For example:
This has a negative gradient.
Both are linear because both produce straight lines.
Directly Proportional Relationships
A special type of linear relationship is a directly proportional relationship.
Two quantities are directly proportional when one is always a constant multiple of the other.
We write:
This means:
where k is the constant of proportionality.
For example:
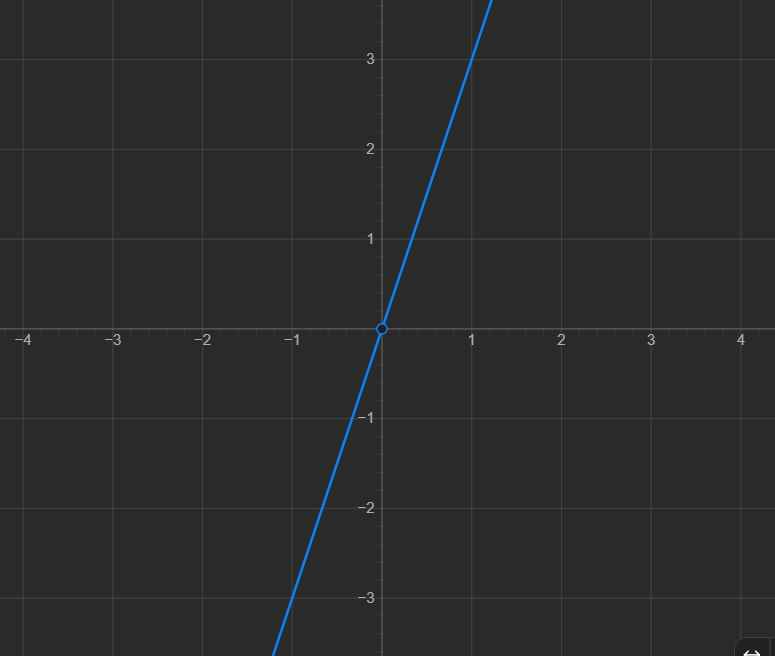
A directly proportional graph has two important features:
- It is a straight line.
- It passes through the origin (0,0).
Linear Does Not Always Mean Directly Proportional
This is an important distinction.
Consider:
This is linear and directly proportional because the graph passes through:
Now consider:
This is still a linear relationship, but it is not directly proportional.
Why?
Because when:
we get:
The graph does not pass through the origin.
Therefore:
All directly proportianl relationships are linear, but not all linear relationships are directly proportional.
The Constant of Proportionality
In a directly proportional relationship:
the value k tells us how much y changes for each unit of x.
We can calculate it using:
Suppose:
| x | y |
|---|---|
| 2 | 10 |
| 4 | 20 |
| 6 | 30 |
| 8 | 40 |
Calculate:
The ratio is constant.
Therefore:
and:
y = 5x
A Physical Example of Direct Proportion
Suppose a material has a density of:
4 g/cm3
The relationship between mass and volume is:
If volume doubles, mass doubles.
If volume triples, mass triples.
The mass-volume graph is a straight line through the origin.
The gradient represents:
\( \frac{mass}{volume} \)
which is the density of the material.
The mathematical pattern therefore tells us something about the physical system.
Non-Linear Relationships
A non-linear relationship does not produce a straight-line graph.
Instead, the graph may curve.
For example:
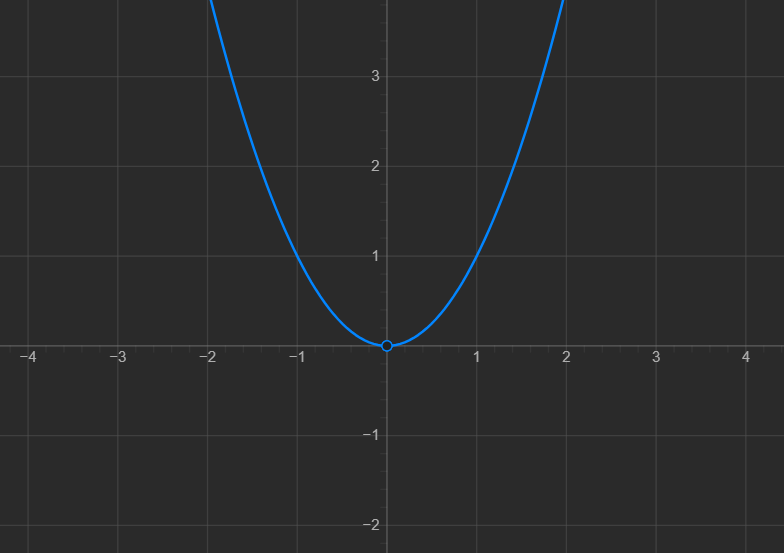
The gradient changes as x changes.
This tells us that y is not changing at a constant rate.
Consider:
| x | |
|---|---|
| 1 | 1 |
| 2 | 4 |
| 3 | 9 |
| 4 | 16 |
| 5 | 25 |
When x doubles from 2 to 4:
It does not simply double.
This is a non-linear relationship.
Recognizing Non-Linear Relationships
A relationship is likely to be non-linear if:
- The graph forms a curve.
- The gradient changes.
- Equal changes in x do not produce equal changes in y.
- A straight line does not fit the data well.
Non-linear does not mean that the graph has no pattern.
A curved graph can represent a very clear mathematical relationship.
Inverse Relationships
An inverse relationship occurs when one variable decreases as the other increases in a particular way.
A common inverse relationship is:
or:
For example:
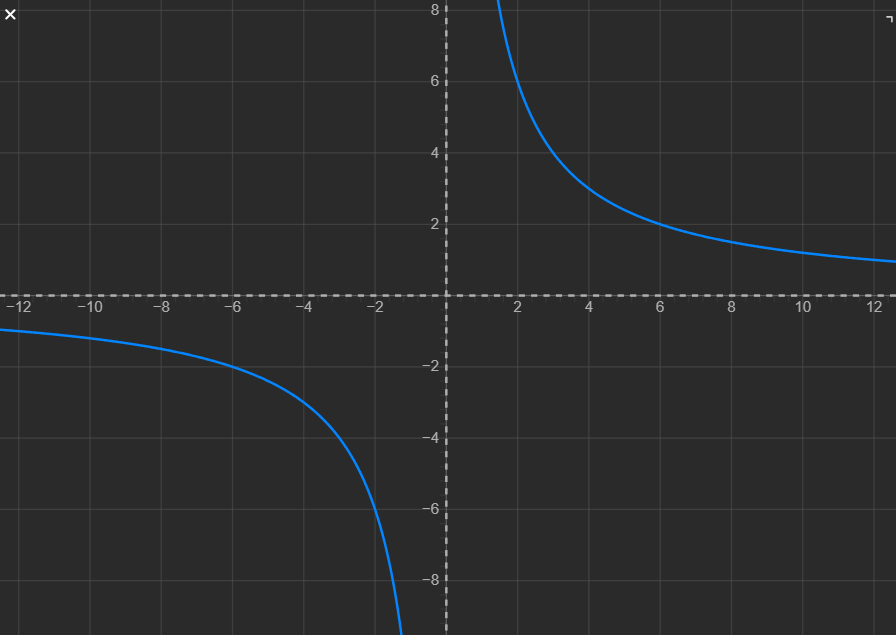
Some values are:
| x | y |
|---|---|
| 1 | 12 |
| 2 | 6 |
| 3 | 4 |
| 4 | 3 |
| 6 | 2 |
| 12 | 1 |
Notice what happens when x doubles:
while:
The value of y is halved.
Testing for an Inverse Relationship
For an inverse relationship:
we can rearrange:
This means that the product of x and y remains constant.
Using the previous data:
Therefore:
and:
A Physical Example of an Inverse Relationship
Imagine travelling a fixed distance.
If your speed increases, the time required for the journey decreases.
For a fixed distance:
where:
- t = time
- d = fixed distance
- v = speed
If the speed doubles, the travel time is halved.
This produces an inverse relationship between speed and time.
The shape of the graph tells us something meaningful about the physical situation.
Direct vs. Inverse Relationships
These two relationships behave very differently.
Direct Proportion
If x doubles:
If x triples:
The graph is a straight line through the origin.
Inverse Proportion
If x doubles:
If x triples:
The graph forms a curve.
Determining a Mathematical Relationship from Data
We can often use patterns in a table or graph to identify the mathematical relationship.
Consider:
| x | y |
|---|---|
| 1 | 4 |
| 2 | 8 |
| 3 | 12 |
| 4 | 16 |
Calculate:
We get:
The ratio is constant.
Therefore:
and:
Another Example
Consider:
| x | y |
|---|---|
| 1 | 20 |
| 2 | 10 |
| 4 | 5 |
| 5 | 4 |
Calculate:
We get:
The product is constant.
Therefore:
and:
Using Graph Shape to Identify Relationships
Different mathematical relationships produce characteristic graph shapes.
| Graph Pattern | Possible Relationship |
|---|---|
| Straight line | Linear |
| Straight line through origin | Directly proportional |
| Downward curve approaching the axes | Inverse |
| Upward curve becoming increasingly steep | Non-linear |
| Scattered points with no pattern | No clear relationship |
Recognizing these shapes is an important graph-analysis skill.
Graph Patterns and Physical Meaning
A graph should not be interpreted only as a mathematical shape.
We should also ask:
What does this pattern mean physically?
Suppose a distance-time graph is a straight line with a constant positive gradient.
This means the object is travelling at a constant speed.
Suppose the graph becomes increasingly steep.
The distance is increasing more rapidly with time, which may indicate that the object is speeding up.
Suppose the graph becomes horizontal.
Distance is no longer changing, so the object has stopped moving.
The shape of the graph therefore tells a story about what is happening physically.
Interpreting Different Sections of a Graph
Sometimes a graph contains several different patterns.
For example, imagine a distance-time graph with three sections.
Section A: Straight Rising Line
Distance increases steadily.
This indicates:
Section B: Horizontal Line
Distance remains constant.
This indicates:
Section C: Steeper Rising Line
Distance increases more quickly.
This indicates:
We can therefore interpret the behaviour of a system by examining different parts of its graph.
A Strategy for Identifying Relationships
When given a graph or table, follow these steps.
Step 1: Identify the Variables
What is plotted on the x-axis?
What is plotted on the y-axis?
Step 2: Examine the Shape
Is the graph:
- Straight?
- Curved?
- Increasing?
- Decreasing?
- Horizontal?
Step 3: Test the Relationship
For direct proportion, check whether:
is constant.
For inverse proportion, check whether:
is constant.
For a general linear relationship, check whether the gradient is constant.
Step 4: Write the Mathematical Relationship
For example:
or:
or:
Step 5: Explain the Physical Meaning
Describe what the relationship means for the quantities being measured.
Did You Know?
Many scientific laws were discovered by identifying mathematical patterns in experimental data.
Scientists often begin with measurements, plot them on graphs, and then look for relationships.
A straight line, curve, gradient, or intercept can reveal the mathematical rule connecting two physical quantities.
This is one reason graphing is such an important connection between mathematics and experimental science.
Key Vocabulary
Relationship – A connection between two variables.
Linear relationship – A relationship represented by a straight-line graph.
Non-linear relationship – A relationship represented by a graph that is not a straight line.
Direct proportion – A relationship in which two variables have a constant ratio.
Inverse relationship – A relationship in which one variable decreases as the other increases, with their product remaining constant for inverse proportion.
Constant of proportionality – The constant value relating two proportional variables.
Gradient – The rate of change of one variable compared with another.
Trend – The overall pattern shown by data.
Variable – A quantity that can change or take different values.
Key Takeaways
- The shape of a graph helps us identify the relationship between variables.
- A linear relationship produces a straight-line graph and has a constant gradient.
- A directly proportional relationship is a straight line that passes through the origin.
- For direct proportion, y/x is constant.
- A straight-line graph that does not pass through the origin is linear but not directly proportional.
- A non-linear relationship produces a curved graph or another pattern with a changing gradient.
- In an inverse proportional relationship, xy is constant.
- If one variable doubles in an inverse relationship, the other halves.
- Mathematical relationships can often be determined by examining graphs and testing patterns in the data.
- Graph patterns should also be interpreted in terms of what they mean physically for the system being studied.