Enzymes and Biological Reactions
3. Factors Affecting Enzyme Activity
Learning outcomes
- I can describe how temperature affects enzyme activity.
- I can explain how pH affects enzyme activity.
- I can identify optimum conditions for enzyme function.
- I can explain what happens when enzymes become denatured.
- I can interpret graphs showing the effects of temperature and pH on enzyme activity.


What Is Enzyme Activity?
Enzyme activity describes how quickly an enzyme catalyzes a chemical reaction.
A high enzyme activity means:
substrate is being converted into product quickly
A low enzyme activity means:
substrate is being converted into product slowly
Enzyme activity can therefore be measured using the rate of reaction.
For example, scientists might measure:
- amount of product produced per minute
- amount of substrate used per minute
- volume of gas produced per minute
- time required for a substrate to disappear
Several conditions can affect enzyme activity. Two of the most important are:
temperature
and:
pH
Why Do Conditions Affect Enzymes?
Most enzymes are proteins.
A protein folds into a specific three-dimensional structure.
This structure produces the enzyme's:
active site


The active site must have suitable:
- shape
- charge
- chemical properties
for the substrate to interact with it effectively.
Anything that changes these properties can affect enzyme activity.
Temperature and Enzyme Activity
Temperature affects how quickly molecules move.
At low temperatures, enzyme and substrate molecules have relatively low kinetic energy.
They move more slowly.
Therefore:
fewer successful enzyme-substrate interactions occur each second
and the reaction rate is relatively low.
Increasing Temperature
As temperature increases, molecules gain kinetic energy.
They move faster.
This increases the frequency of collisions between:
enzyme molecules
and:
substrate molecules
More collisions can result in successful formation of enzyme-substrate complexes.
Therefore, enzyme activity usually:
increases as temperature increases — up to a certain point.


The Optimum Temperature
The temperature at which an enzyme shows its highest activity under particular conditions is called its:
optimum temperature
At the optimum temperature:
- molecules have sufficient kinetic energy
- enzyme-substrate interactions occur frequently
- the enzyme maintains a functional structure
- reaction rate is high
Different enzymes can have different optimum temperatures.
A Typical Temperature Graph
A typical enzyme-temperature graph often looks approximately like this:
Effect of temperature on enzyme activity
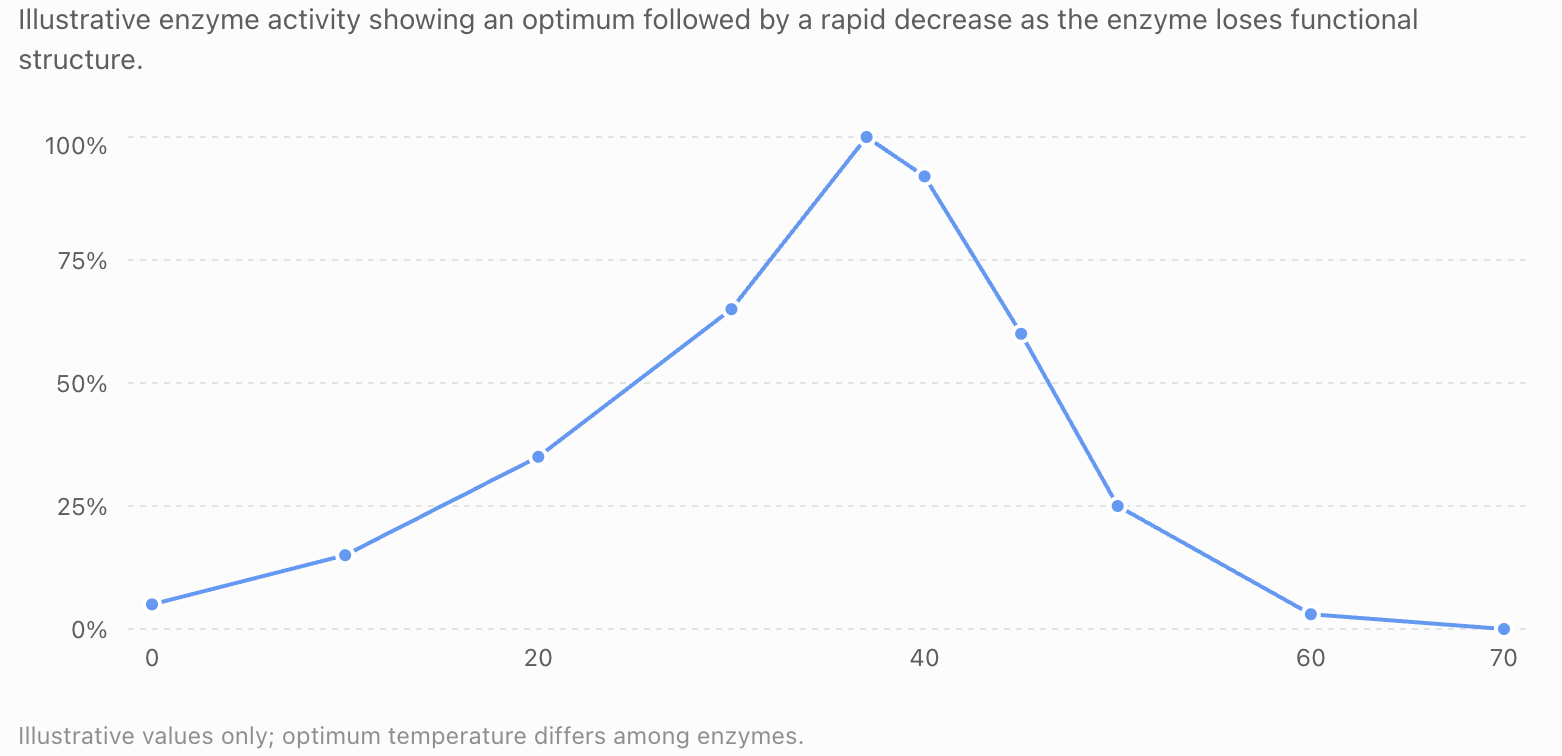
The values shown are illustrative rather than measurements for every enzyme.
The important pattern is:
low temperature → low activity
increasing temperature → increasing activity
optimum temperature → maximum activity
above optimum → rapid decrease in activity
Why Does Activity Increase Before the Optimum?
As temperature rises:
temperature increases
↓
kinetic energy increases
↓
enzyme and substrate molecules move faster
↓
collision frequency increases
↓
more enzyme-substrate complexes can form
↓
reaction rate increases
This continues while the enzyme maintains a functional structure.
What Happens Above the Optimum?
Increasing temperature beyond the optimum does not continue increasing enzyme activity.
Instead, high temperatures can disrupt interactions that maintain the enzyme's three-dimensional structure.
The protein begins to lose its normal shape.
The active site changes.


As a result, the substrate may no longer bind effectively.
Fewer enzyme-substrate complexes form.
The reaction rate decreases.
Denaturation
A significant loss of an enzyme's normal three-dimensional structure is called:
denaturation
When an enzyme becomes denatured:
- its protein structure changes
- its active site's shape and chemistry change
- the substrate may no longer bind effectively
- catalytic activity decreases or may stop
A useful sequence is:
high temperature → protein structure disrupted → active site altered → reduced substrate binding/catalysis → lower reaction rate
Denaturation Does Not Mean the Enzyme Dies
An enzyme is not a living organism.
Therefore, it is better to say:
the enzyme becomes denatured
rather than:
the enzyme dies
Denaturation is a structural change in a biological molecule.
Low Temperature Is Different from High Temperature
Low temperature and high temperature can both produce low enzyme activity, but for different reasons.
Low temperature
The enzyme generally remains structurally intact.
Molecules simply have less kinetic energy and move more slowly.
If the temperature rises again, activity can usually increase.
Very high temperature
The enzyme's structure may be disrupted.
The enzyme may become denatured.
Restoring the original temperature does not necessarily restore the enzyme's original structure or activity.
This is an important distinction.
Temperature: The Complete Pattern
At low temperature:
slow molecular movement → fewer successful interactions → low activity
As temperature increases:
faster movement → more successful interactions → increasing activity
At optimum temperature:
highest activity
Above optimum:
enzyme structure increasingly disrupted → active site changes → activity falls
At sufficiently high temperature:
extensive denaturation → little or no activity
Do All Enzymes Have the Same Optimum Temperature?
No.
The optimum temperature depends on the enzyme and the organism.
Many enzymes in the human body function effectively near normal body temperature, around:
37°C
But this does not mean every enzyme has an optimum of exactly 37°C.


Organisms live in very different environments.
Some microorganisms live in:
- hot springs
- deep-sea hydrothermal environments
- cold oceans
- polar regions
Their enzymes can be adapted to function under very different temperature conditions.
Reading a Temperature Graph
Suppose a graph shows enzyme activity against temperature.
Look for several features.
1. The x-axis
Usually represents:
temperature (°C)
2. The y-axis
Usually represents:
enzyme activity or reaction rate
3. The highest point
Represents the:
optimum temperature
4. The rising section
Shows increasing activity as temperature rises.
5. The falling section
Shows decreasing activity as high temperature increasingly disrupts enzyme structure.
Example: Interpreting a Temperature Graph
Imagine an enzyme has the following results:
| Temperature | Relative Activity |
|---|---|
| 10°C | 15% |
| 20°C | 35% |
| 30°C | 65% |
| 37°C | 100% |
| 45°C | 60% |
| 55°C | 10% |
We can conclude:
The enzyme's optimum temperature in this experiment is approximately:
37°C
At 20°C, the enzyme still functions, but more slowly.
At 55°C, activity is very low, consistent with substantial loss of functional enzyme structure.
Be Careful with the Word "Optimum"
The optimum is the condition under which the measured enzyme activity is greatest.
It does not mean:
- the enzyme cannot function at other temperatures
- every enzyme has the same optimum
- the organism itself necessarily prefers exactly that condition
For example, an enzyme may still function at 25°C even if its measured optimum is 37°C.
It simply functions more slowly under those experimental conditions.
pH and Enzyme Activity
Temperature is not the only important factor.
Enzyme activity is also strongly influenced by:
pH
pH describes how acidic or alkaline a solution is.


A simplified pH scale runs from:
0 to 14
Generally:
pH below 7 = acidic
pH 7 = neutral
pH above 7 = alkaline
Why Does pH Affect Enzymes?
Changes in pH alter the concentration of hydrogen ions in the environment.
This can affect electrical charges and interactions within proteins.
Because these interactions help maintain enzyme structure, changes in pH can alter:
- protein folding
- active-site shape
- active-site charge
- substrate binding
- catalytic activity
Therefore:
pH change → altered protein interactions → altered active site → changed enzyme activity
Optimum pH
The optimum pH is the pH at which an enzyme has its highest activity under particular conditions.
Different enzymes can have different optimum pH values.
This makes sense because enzymes operate in different parts of organisms.
For example:
- stomach enzymes experience strongly acidic conditions
- many enzymes inside cells operate near neutral conditions
- some intestinal enzymes operate under more alkaline conditions
A Typical pH Graph
A pH-activity graph often forms a peak around the enzyme's optimum.
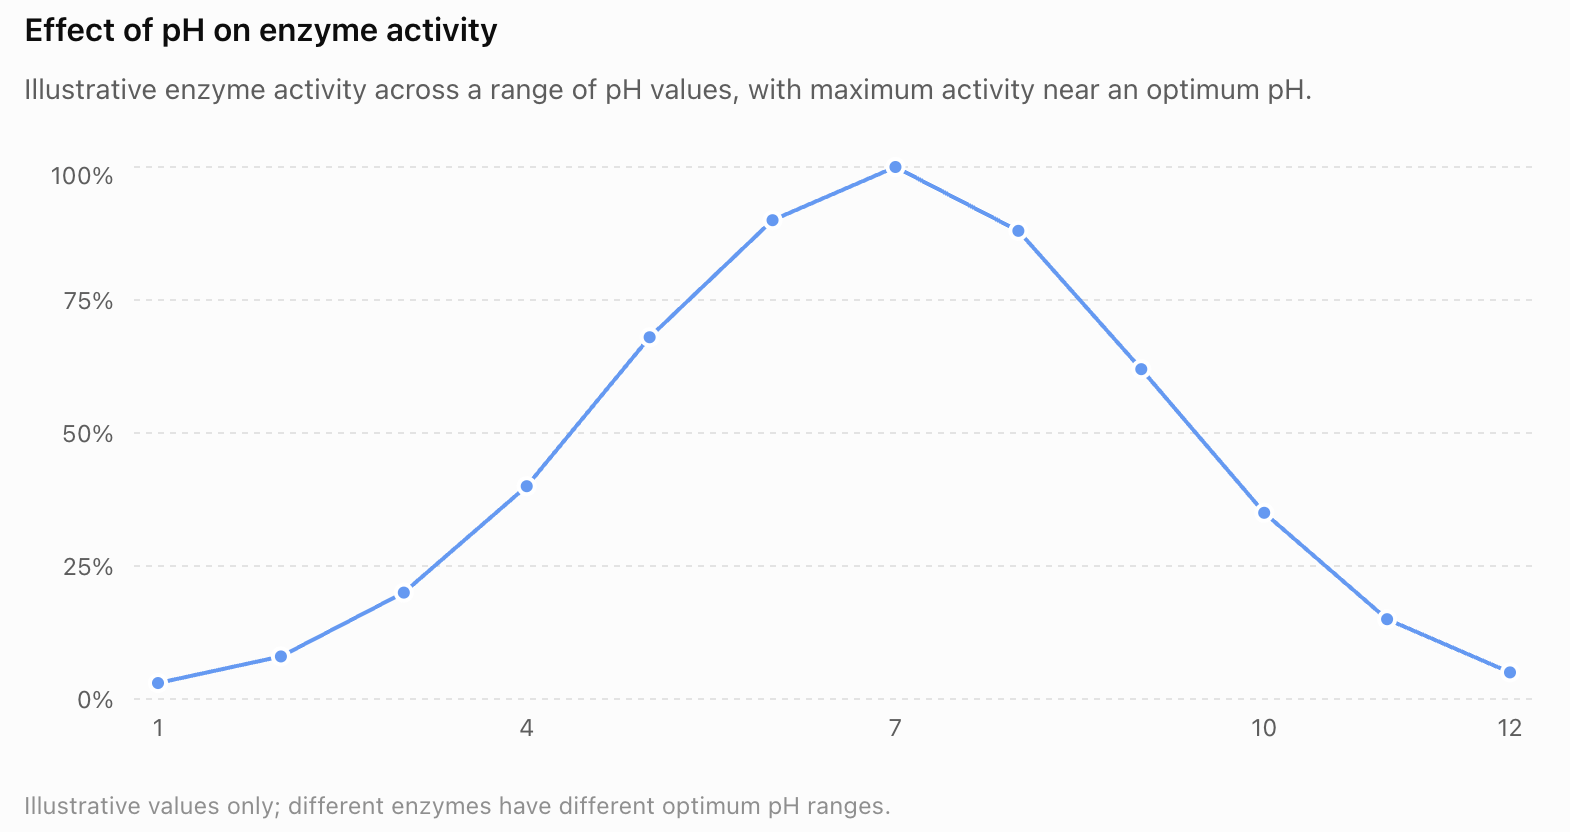
In this illustrative example, the enzyme's optimum pH is approximately:
pH 7
Activity decreases as conditions move farther from the optimum.
pH Graphs Can Have Different Shapes
Not every enzyme has an optimum near pH 7.
Consider digestive enzymes.
Pepsin functions in the stomach.
The stomach is strongly acidic.
Therefore, pepsin is adapted to function under acidic conditions.
Trypsin functions in the small intestine, where conditions are more alkaline.


Their pH-activity curves therefore peak in different regions.
Example: Pepsin
Pepsin is a protease involved in protein digestion in the stomach.
It functions effectively in acidic conditions.
A simplified pattern might show:
maximum activity around pH 2
and much lower activity near neutral or alkaline pH.
This makes biological sense because the stomach contains hydrochloric acid.
Example: Trypsin
Trypsin is another protease.
It functions in the small intestine.
Its optimum pH is typically in the alkaline range rather than strongly acidic conditions.
Therefore:
Pepsin and trypsin can catalyze protein digestion but are adapted to different environments.
Enzyme Adaptation to Location
Different regions of the digestive system have different conditions.


For example:
Mouth
Approximately neutral conditions.
Amylase begins starch digestion.
Stomach
Strongly acidic conditions.
Pepsin digests proteins.
Small intestine
More alkaline conditions than the stomach.
Several digestive enzymes function here.
Enzymes are therefore adapted to the conditions where they normally operate.
What Happens at Extreme pH?
If pH becomes too far from an enzyme's suitable range, interactions maintaining the protein's structure can be disrupted.
The active site's:
- shape
- charge
- chemical properties
may change.
The substrate may no longer bind effectively.
At sufficiently extreme pH, the enzyme may become denatured.


Temperature and pH Compared
Both temperature and pH can influence enzyme structure and activity.
| Factor | Below/away from optimum | At optimum | Extreme conditions |
|---|---|---|---|
| Temperature | Lower molecular movement and activity | Highest activity | Protein structure may be disrupted |
| pH | Active-site interactions become less favorable | Highest activity | Protein structure and active-site chemistry may be severely disrupted |
| Result | Lower reaction rate | Maximum reaction rate | Very low activity or denaturation |
What Is an Optimum Condition?
An optimum condition is a condition at which an enzyme shows its greatest activity under the conditions being tested.
Enzymes may have:
- optimum temperature
- optimum pH
- suitable substrate concentration
- suitable ionic conditions
The word optimum means:
best for maximum measured activity
not simply:
normal
Optimum Conditions Can Differ
Consider two hypothetical enzymes.
Enzyme A
Optimum temperature = 37°C
Optimum pH = 7
Enzyme B
Optimum temperature = 70°C
Optimum pH = 4
These enzymes are adapted to very different conditions.
You cannot determine optimum conditions simply from the fact that something is an enzyme.
They must be measured experimentally.
Temperature Graph vs pH Graph
Temperature and pH graphs often have different shapes.
A typical temperature graph is often asymmetrical:
- gradual increase toward optimum
- relatively steep decrease above optimum
A typical pH graph is often more peak-shaped:
- activity rises toward optimum
- activity falls as conditions move away from optimum on either side


Understanding these shapes helps when interpreting experimental results.
Why Is the Temperature Curve Often Asymmetrical?
Below the optimum, increasing temperature increases molecular motion and collision frequency.
Above the optimum, another process becomes increasingly important:
loss of functional protein structure
Once significant structural disruption begins, activity can decrease rapidly.
Therefore, the two sides of the graph do not necessarily form a symmetrical curve.
How to Interpret an Enzyme Graph
When given an enzyme graph:
Step 1: Read the x-axis.
What factor is being changed?
Temperature?
pH?
Step 2: Read the y-axis.
What is being measured?
Reaction rate?
Product formation?
Time?
Step 3: Locate the maximum.
This identifies the approximate optimum.
Step 4: Describe the pattern.
Do not simply say:
"it goes up and down."
Instead write:
Activity increases as temperature rises to approximately 40°C, reaches a maximum, and then decreases rapidly at higher temperatures.
Step 5: Explain the pattern scientifically.
Connect the graph to:
- molecular movement
- collisions
- enzyme-substrate complexes
- protein structure
- active-site shape
- denaturation
Describe vs Explain
These are different scientific skills.
Describe
State what the data show.
Example:
Enzyme activity increases from 10°C to 40°C and then decreases rapidly above 40°C.
Explain
Give the scientific reason.
Example:
Increasing temperature initially increases kinetic energy and collision frequency. Above the optimum, enzyme structure becomes increasingly disrupted, altering the active site and reducing catalytic activity.
A strong answer often does both.
Interpreting Rate of Reaction
The y-axis may not always say:
enzyme activity
Instead, it might show:
oxygen produced (cm³/min)
or:
product produced per minute
or:
substrate broken down per minute
These are still measurements of reaction rate and can therefore indicate enzyme activity.
What If the Graph Measures Time?
Sometimes an experiment measures the time required for a reaction to finish.
This changes how you interpret the graph.
If the reaction happens faster:
less time is required
Therefore:
shorter reaction time = greater enzyme activity
This is the opposite of a graph directly showing reaction rate.
Example: Catalase Investigation
Catalase breaks hydrogen peroxide into water and oxygen.
2H₂O₂ → 2H₂O + O₂


A student could investigate temperature by measuring:
volume of oxygen produced in 60 seconds
at:
- 10°C
- 20°C
- 30°C
- 40°C
- 50°C
- 60°C
The temperature producing the greatest oxygen volume per minute would indicate the highest activity under those conditions.
Designing a Temperature Investigation
Suppose temperature is the independent variable.
Change:
temperature
Measure:
reaction rate
Keep constant:
- enzyme concentration
- enzyme volume
- substrate concentration
- substrate volume
- pH
- reaction time
This creates a fair test.
Designing a pH Investigation
To investigate pH:
Change:
pH
Measure:
reaction rate
Keep constant:
- temperature
- enzyme concentration
- substrate concentration
- volumes
- reaction time
Scientists often use buffer solutions to maintain specific pH values during experiments.
Why Control Variables Matter
Suppose you change both:
temperature
and:
enzyme concentration
If the reaction becomes faster, you would not know which change caused the effect.
Therefore, when investigating one factor, other important variables should remain controlled.
This allows a valid conclusion.
Enzyme Activity and Substrate Concentration
Although temperature and pH are the focus here, other factors also affect enzyme activity.
One is:
substrate concentration
As substrate concentration increases:
- more substrate molecules are available
- collisions with active sites become more frequent
- reaction rate generally increases
Eventually, most active sites are occupied frequently.
The reaction approaches a maximum rate.


Enzyme Activity and Enzyme Concentration
Increasing enzyme concentration provides more active sites.
If sufficient substrate is available:
more enzyme → more available active sites → faster reaction
For example:
Double the amount of enzyme while maintaining excess substrate.
The reaction rate may approximately double under suitable conditions.
However, if substrate becomes limiting, adding more enzyme will have less effect.
Four Important Factors
Enzyme activity can therefore depend on:
- temperature
- pH
- substrate concentration
- enzyme concentration
Other factors can also matter, including:
- inhibitors
- activators
- ionic conditions
- availability of cofactors
But temperature and pH are especially important because they can directly affect enzyme structure and active-site properties.
Denaturation and the Active Site
Before denaturation:
active site has suitable structure → substrate interacts effectively
After substantial denaturation:
active site altered → substrate interaction reduced → catalytic activity decreases

This provides a direct connection between:
enzyme structure
and:
enzyme function
Can a Denatured Enzyme Recover?
Sometimes small structural changes can be reversible if conditions return to normal.
However, substantial denaturation is often effectively irreversible under biological conditions.
Therefore, it is safest to understand denaturation as:
a loss of the normal protein structure required for enzyme function
rather than assuming every denatured enzyme can simply return to normal.
Real-World Example: Fever
Human enzymes function within a relatively narrow physiological temperature range.
A moderate increase in temperature can influence reaction rates.
Extremely high body temperatures can disrupt normal cellular processes and damage proteins.
This is one reason maintaining body temperature within a suitable range is important for normal metabolism.
Real-World Example: Refrigeration
Why does refrigeration help preserve food?
At low temperatures:
- molecules move more slowly
- enzyme-controlled reactions slow
- microbial metabolism generally slows


Low temperature does not necessarily destroy enzymes.
Instead, it generally reduces reaction rates.
Real-World Example: Cooking
High temperatures during cooking can denature proteins, including enzymes.
Once many enzymes in food or microorganisms become denatured, they can no longer perform their normal catalytic functions effectively.
This is very different from refrigeration.
Cooling → slows enzyme activity
Strong heating → can denature enzymes
Real-World Example: Digestive System
The digestive system provides excellent examples of enzymes adapted to different pH conditions.


Salivary amylase begins functioning in the mouth.
Pepsin functions in acidic stomach conditions.
Other digestive enzymes function in the small intestine under different pH conditions.
The conditions of each location influence which enzymes function effectively there.
Comparing Two Enzymes from a Graph
Suppose a graph shows:
Enzyme A optimum pH = 2
Enzyme B optimum pH = 8
A reasonable interpretation could be:
Enzyme A is adapted to a more acidic environment than Enzyme B.
If additional biological information identifies Enzyme A as pepsin and Enzyme B as an intestinal enzyme, their different optima can be connected to their locations.
Avoid assuming the location from the graph alone unless the question provides supporting information.
Graph Question Example 1
A graph shows maximum enzyme activity at:
42°C
At 20°C, activity is much lower.
At 65°C, activity is almost zero.
What is the optimum temperature?
Approximately:
42°C
Why is activity lower at 20°C?
The molecules have less kinetic energy, so enzyme and substrate interactions occur less frequently.
Why is activity very low at 65°C?
The high temperature has likely caused substantial disruption of enzyme structure, reducing active-site function.
Graph Question Example 2
An enzyme has maximum activity at:
pH 3
Its activity is very low at:
pH 9
What can we conclude?
The enzyme functions most effectively under acidic conditions.
At pH 9, changes in charge and protein interactions make the active site less suitable for effective catalysis.
Graph Question Example 3
Two enzymes are tested.
Enzyme X:
Optimum pH = 2
Enzyme Y:
Optimum pH = 7
Can we say Enzyme Y is "better"?
No.
The enzymes may perform different functions or operate in different environments.
The graph only tells us about their activities under the tested conditions.
This is an important principle when interpreting scientific data.
Common Misconception: Higher Temperature Is Always Better
Incorrect:
higher temperature → always faster reaction
Correct:
higher temperature → faster reaction only up to an optimum
Beyond the optimum:
enzyme activity decreases as functional structure is increasingly lost
Common Misconception: Cold Denatures Enzymes
Low temperatures generally reduce enzyme activity because molecular movement is slower.
This is different from the structural disruption caused by high temperatures.
In many cases:
warming the enzyme again → activity increases
provided the enzyme has not been otherwise damaged.
Common Misconception: All Enzymes Work Best at 37°C
37°C is important because it is close to normal human body temperature.
But enzymes exist throughout the living world.
Different enzymes have different optimum temperatures.
Never assume:
optimum = 37°C
unless the data or context support it.
Common Misconception: All Enzymes Work Best at pH 7
Some enzymes function well near neutral pH.
Others do not.
Pepsin functions effectively under strongly acidic conditions.
Other enzymes function under alkaline conditions.
Therefore:
different enzymes → different optimum pH values
Common Misconception: Optimum Means the Only Working Condition
An enzyme may function over a range of conditions.
The optimum is simply where its activity is greatest under the conditions tested.
For example, an enzyme with an optimum of 40°C may still function at:
20°C
30°C
50°C
but at lower rates.
Common Misconception: Denaturation Breaks the Enzyme into Individual Amino Acids
Denaturation generally disrupts the protein's higher-level three-dimensional structure.
It does not necessarily break all peptide bonds or separate the protein completely into individual amino acids.
The critical point is that:
the functional three-dimensional structure is altered
and therefore the enzyme may no longer work properly.
A Reliable Method for Graph Questions
When interpreting enzyme graphs, use:
Identify → Describe → Explain
Identify
Find the optimum.
Example:
The optimum temperature is approximately 40°C.
Describe
State the pattern.
Activity increases between 10°C and 40°C and decreases rapidly above 40°C.
Explain
Give the biological reason.
Increasing temperature initially increases kinetic energy and collision frequency. Above the optimum, enzyme structure becomes increasingly disrupted, altering the active site and decreasing catalytic activity.
This produces a strong scientific answer.
Worked Graph Interpretation
Suppose an enzyme produces the following data:
| Temperature | Reaction Rate |
|---|---|
| 10°C | 2 |
| 20°C | 5 |
| 30°C | 9 |
| 40°C | 14 |
| 50°C | 7 |
| 60°C | 1 |
Identify the optimum.
The greatest reaction rate is:
14
at:
40°C
Therefore, the optimum temperature under these experimental conditions is approximately:
40°C
Describe the trend.
Reaction rate increases from 10°C to 40°C and then decreases rapidly between 40°C and 60°C.
Explain the trend.
Below 40°C, increasing temperature increases molecular kinetic energy and successful enzyme-substrate interactions. Above the optimum, increasing disruption of the enzyme's structure changes active-site function, causing the reaction rate to decrease.
Practical Investigation: Catalase and Temperature
Catalase provides a useful way to investigate enzyme activity.
Possible equipment:
- hydrogen peroxide
- catalase source such as potato
- test tubes
- water baths
- thermometer
- stopwatch
- gas syringe or another suitable gas-measuring method


Possible temperatures:
10°C
20°C
30°C
40°C
50°C
60°C
Measure oxygen production over a fixed time.
Then plot:
temperature vs reaction rate
The graph can be used to estimate the enzyme's optimum temperature under the experimental conditions.
Practical Investigation: Enzyme and pH
A similar experiment can investigate pH.
Possible pH values:
pH 3
pH 5
pH 7
pH 9
pH 11
Use buffer solutions to maintain each pH.
Keep temperature constant.
Measure reaction rate.
Plot:
pH vs enzyme activity
The peak of the graph indicates the approximate optimum pH under the conditions tested.
Improving Experimental Reliability
Enzyme experiments can contain random variation.
A better investigation should:
- repeat each condition several times
- calculate a mean
- control important variables
- use consistent volumes
- maintain temperature carefully
- maintain pH with buffers
- use accurate timing
- measure reaction rate quantitatively when possible
Repeated measurements help identify unusual results and improve confidence in the pattern.
Did You Know?
Enzymes can be adapted to extremely unusual environments.


For example, Taq polymerase comes from the bacterium Thermus aquaticus, originally isolated from hot-spring environments.
Taq polymerase remains functional at temperatures that would severely disrupt many ordinary enzymes.
This property makes it extremely useful in PCR, a laboratory technique used to copy DNA.
Its use demonstrates an important principle:
An enzyme's optimum conditions reflect the environment and biological role to which its structure is adapted.
Key Terms
- Enzyme activity: Rate at which an enzyme catalyzes a reaction.
- Reaction rate: Speed at which reactants are converted into products.
- Optimum temperature: Temperature at which an enzyme shows maximum activity under specified conditions.
- Optimum pH: pH at which an enzyme shows maximum activity under specified conditions.
- Denaturation: Loss of normal protein structure required for proper function.
- Active site: Region of an enzyme where substrate binding and catalysis occur.
- Substrate: Molecule acted upon by an enzyme.
- Enzyme-substrate complex: Temporary combination of enzyme and substrate.
- Kinetic energy: Energy associated with motion.
- pH: Measure related to the acidity or alkalinity of a solution.
- Acidic: Having a pH below 7 under the usual aqueous scale.
- Neutral: Approximately pH 7 under standard conditions.
- Alkaline: Having a pH above 7 under the usual aqueous scale.
- Buffer: Solution that resists changes in pH.
- Control variable: Factor kept constant during an investigation.
- Optimum: Condition producing the greatest measured activity.
- Thermostable: Able to maintain function at relatively high temperatures.
Key Relationships
For temperature:
low temperature → low kinetic energy → fewer successful interactions → low activity
increasing temperature → increasing kinetic energy → more successful interactions → increasing activity
optimum temperature → maximum activity
excessive temperature → structural disruption/denaturation → altered active site → decreasing activity
For pH:
optimum pH → active-site properties suitable for catalysis → maximum activity
pH far from optimum → altered charges/interactions → altered active-site properties → reduced activity
At extreme conditions:
loss of functional enzyme structure → greatly reduced or absent catalytic activity
Key Takeaways
- Enzyme activity describes the rate at which an enzyme catalyzes a reaction.
- Temperature affects enzyme activity by influencing molecular movement and enzyme structure.
- At low temperatures, molecules move more slowly and enzyme activity is generally lower.
- Increasing temperature increases kinetic energy and collision frequency.
- Enzyme activity generally increases with temperature until an optimum is reached.
- The optimum temperature is the temperature at which measured enzyme activity is greatest under particular conditions.
- Above the optimum temperature, enzyme activity usually decreases rapidly.
- High temperatures can disrupt the three-dimensional structure of enzymes.
- Structural changes can alter the active site and reduce substrate binding and catalysis.
- Significant loss of functional protein structure is called denaturation.
- Low temperature generally slows enzymes rather than denaturing them.
- Different enzymes can have different optimum temperatures.
- Not all enzymes have an optimum temperature of 37°C.
- pH can affect enzyme structure, active-site charge, substrate binding, and catalytic activity.
- Each enzyme has a pH range within which it functions effectively.
- The optimum pH is where measured activity is greatest.
- Different enzymes can have very different optimum pH values.
- Pepsin functions effectively in acidic stomach conditions.
- Enzymes operating elsewhere in the body may be adapted to neutral or alkaline conditions.
- Extreme pH can disrupt enzyme structure and reduce activity.
- Temperature graphs often rise toward an optimum and then fall relatively sharply.
- pH graphs often show a peak around an optimum range.
- The highest point on an enzyme-activity graph identifies the approximate optimum under the tested conditions.
- Graph descriptions should state what happens; explanations should give the biological reason.
- If a graph measures reaction time rather than reaction rate, a shorter time indicates greater enzyme activity.
- Substrate concentration and enzyme concentration can also influence enzyme activity.
- Controlled variables are important when investigating enzyme activity experimentally.
- Repeating measurements and calculating means improves reliability.
- Enzymes can be adapted to very different environmental conditions.
- Enzyme function depends strongly on maintaining the structure and chemical properties of the active site.
- A useful approach to enzyme graphs is: Identify → Describe → Explain.