Atomic Energy Levels and Transitions

2. Emission Spectra

Learning Outcomes
  • I can explain how emission spectra are produced.
  • I can identify the characteristics of line spectra.
  • I can describe the hydrogen emission spectrum.
  • I can explain why different elements have unique spectra.
  • I can use spectra to identify elements.

Emission Spectra

When atoms receive energy, their electrons can move from lower energy levels to higher energy levels. These electrons do not usually remain in the higher-energy excited states for long.

When an electron falls back to a lower energy level, the atom releases energy as a photon of light.

Because electrons in atoms can occupy only specific, quantized energy levels, only particular amounts of energy can be released. This produces particular wavelengths of light rather than every possible wavelength.

When these wavelengths are separated, they form an emission spectrum.

https://images.openai.com/static-rsc-4/-6GjBtPRSP7iWTIvkv3xtxjne_eoRmN0SMc9of52IIZ1-BNx2TCeW-EB_0fJO5O77Lpu6k4qLidb3yLzkaURq1EBIjK7yPfdvM_I94kJYOo9dgh-GyZa0HF0kSYTcqkmxarC9e3i9aKe3bjepUQF2ahIoUN3Ln6zpiwBkKy6oyGtl_EhUbw8QIHawwGSpWFb?purpose=fullsize
 
https://images.openai.com/static-rsc-4/RwaJfpWgYTOdAHmCCKmsjHgbna7fLeYwRiYUA7ULWKF2WsraHz2xn_SmlMSGRLw8yyW08itg93Bv-qZzatf1_ohw1_EcYFpdKoBNNwtuAIxhj77IeEPM-EHSvxgOTRV8WD_XhqnxQ2CL2IS6klVM7u8Xt191wzXae_LFGtw-5MQX4UlSlpDNnQctSp9wJjDR?purpose=fullsize
 
https://images.openai.com/static-rsc-4/7Jsd30JWD-_MZD1opp4VK7YukyOJ5dGt7px3BQa3ckJ_yRZzV_ZQPUR2CfUAtI9okEVog6kzdJWJzcWbQifMfeMAgVAcql7tNnJa-BhXSYnOipbnyPDhvJ2n5K641inoqmr4lptMacZJfCwL66r9hFmy4XavzpV__Ruli4v3EGLhYO7So15_M_0LHI5azfkJ?purpose=fullsize
 
5

How an Emission Spectrum Is Produced

An emission spectrum begins when atoms receive energy.

This might happen when:

  • a gas is heated
  • an electric current passes through a gas
  • atoms absorb electromagnetic radiation
  • particles collide with atoms
  • atoms are exposed to a high-energy source

The added energy can excite electrons.

An electron may move:

lower energy level → higher energy level

The atom is then in an excited state.

Eventually, the electron can return to a lower energy level:

higher energy level → lower energy level

The energy difference is released as a photon.

The basic process is:

Energy supplied → electron excited → electron returns to lower level → photon emitted


Energy Levels and Emitted Photons

Suppose an electron falls from an energy level E₃ to E₂.

The energy of the emitted photon is equal to the difference between the two levels:

E_photon = E₃ − E₂

More generally, the magnitude of the photon energy is:

E_photon = |E_final − E_initial|

The energy of a photon is also related to its frequency:

E = hf

where:

E = photon energy

h = Planck's constant

f = frequency

Therefore, the energy difference between the atomic levels determines the frequency of the emitted light.


Energy, Frequency, and Wavelength

Frequency and wavelength are related by:

c = fλ

where:

c = speed of light

f = frequency

λ = wavelength

This means:

larger energy gap → higher photon energy → higher frequency → shorter wavelength

and:

smaller energy gap → lower photon energy → lower frequency → longer wavelength

Different electron transitions therefore produce different wavelengths of light.

https://images.openai.com/static-rsc-4/urIoW3_9Sl7VbbbNd4hW4IxF4oEuCeJeKQHT4ppi5576oVqO2SiwVv4exh2UIgXG91036OhKnqBk2uxivv8qLCabOYnS5Z75owLSMk0LgrhRxKVe7ZXKhntWrr6U4oQS3jnnGpouE7XJN3pQmStoql9pyR7mtG1DHeYMmAc8UtiLrtp8V5yCCuwXIeJ_ufj4?purpose=fullsize
 
https://images.openai.com/static-rsc-4/us_lQ7uL4mcR2fcvd5hZwl_lTu4IIO3cda7MPY9AiwiUv4QfIveYGQ7imMrqueqUQKjcKKk84XbxJ8CLA0kUQk5ZM8q30PFYMoCiNAT1hrn_dFU4Mv513WrzvAl62zWPMqcNwkFHp3I4Qi4RTI7bUFJ4yclqyFUhtdfw8SkhvN89caUG3TUfGEwSDKGZhrpB?purpose=fullsize
 
https://images.openai.com/static-rsc-4/T4isAcM3NW2rIuQLaqsSNny33DwrXNXyyl2f4J7hgFvXOh_LmoY33p7Gj9H7md8pFVbN_q2zuEuE3aT7AK11TIPYWVyNTByAaYvQbhKoQ4Io8P5CQAmsVX9cgUfkOlWGaO5QBGc-NFT-FsdqwFqR151BBvi5QLwI88X5rkHKLokStN6gEnJGQKxq9do2SS-2?purpose=fullsize
 
5

What Is an Emission Spectrum?

An emission spectrum is the pattern of electromagnetic radiation emitted by a substance.

For individual atoms in a low-density gas, the spectrum consists of separate wavelengths.

When visible light from the gas is passed through a prism or diffraction grating, these wavelengths appear as separate coloured lines against a dark background.

This is called a:

line emission spectrum

or simply a:

line spectrum.


Continuous Spectrum vs Line Spectrum

A hot, dense object can produce a continuous spectrum containing a broad range of wavelengths.

A low-density excited atomic gas produces a line spectrum containing only particular wavelengths.

Continuous Spectrum

Contains an essentially uninterrupted range of wavelengths.

It looks like a continuous rainbow.

Line Emission Spectrum

Contains separate bright lines.

There are dark spaces between the lines because those wavelengths are not being emitted strongly by that atomic gas.

https://images.openai.com/static-rsc-4/fqtRyQuI0bxTpOkGrQeBFinbZuokR0l-T--tOwMy215-L3-KB6_LwrHR-UnfQ-bO7qMY7qA4VN2-yrnU9zcPyWZOaVkJaCoMN-FTxv0OlgW1DjGZPj0y9V3VdX8XXJ4LfguFcmVmBC_jAiahuKG8-iBoUDcQGP1XomC_D5vZ30l-IXekuhBYhO-bzMWCXrK-?purpose=fullsize
 
https://images.openai.com/static-rsc-4/z5OK2KI4I-PQBywW0HcCfDuhGuGQWFIVipASnDbZjb3KVoDHIWubGwyQuGAWKdALDoxL8a_1kqrjTsW7bV8qKE8SpxHDNTFXOI6BW8GPhiAlGdu2nP-_QJtnjfp4oS_OpZcrLHrD9mNrSEmbpwaBIYQDEZs1K0ASNE38pAH0vjE23iRLVtR8WwnYKDbpzC64?purpose=fullsize
 
https://images.openai.com/static-rsc-4/dYG4Gnn7L7p4_DWAL_5v-2EqIceETYoUylsMIrA2ooy8jk7zoJ0rCbm5k0-8vTVhxSjUsAhZvtykauh5fouKo40lVhdfOwNHlX2vSasV2RqiDByRgihdevpr5F8E5Bubag6Kq1J1T8iFEud1fou0kgZhaj74We3dtIqsP5q8d7HNcHv8ZmU-N_FUbJF2Q6MZ?purpose=fullsize
 
5

Why Are There Separate Lines?

Suppose an atom has four allowed energy levels:

E₄

E₃

E₂

E₁

An electron might make transitions such as:

E₄ → E₃

E₄ → E₂

E₄ → E₁

E₃ → E₂

E₃ → E₁

E₂ → E₁

Each transition has a particular energy difference.

Therefore, each transition can produce a photon with a particular energy.

Since:

E = hf

each photon has a particular frequency.

Since:

c = fλ

each photon also has a particular wavelength.

Therefore:

specific energy gaps → specific photon energies → specific wavelengths → spectral lines


Emission Spectra Are Evidence for Quantized Energy

Line spectra provide powerful evidence that atomic energy levels are quantized.

If electrons could have any energy, atoms could emit essentially any photon energy, producing a continuous range of wavelengths.

Instead, atoms emit particular wavelengths.

This shows that electron transitions occur between particular allowed energy states.

The dark gaps between emission lines are therefore just as important as the bright lines: they show that many intermediate photon energies are not produced by those particular atomic transitions.


The Hydrogen Emission Spectrum

Hydrogen is the simplest atom, containing:

  • one proton
  • one electron

Its relatively simple structure makes its spectrum especially important in the development of atomic physics.

When hydrogen gas is excited, its electron can move to higher energy levels.

When the electron returns to lower levels, photons are emitted.

The resulting spectrum contains a series of discrete lines.

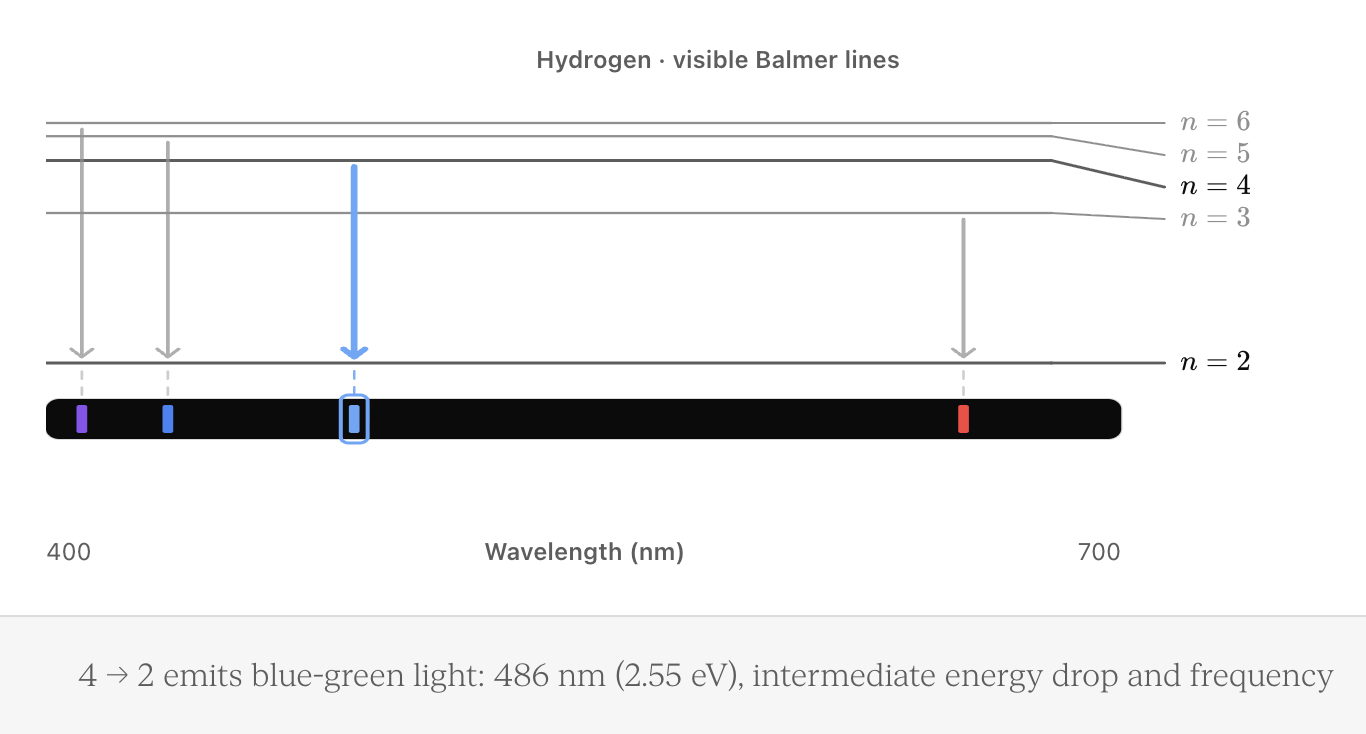
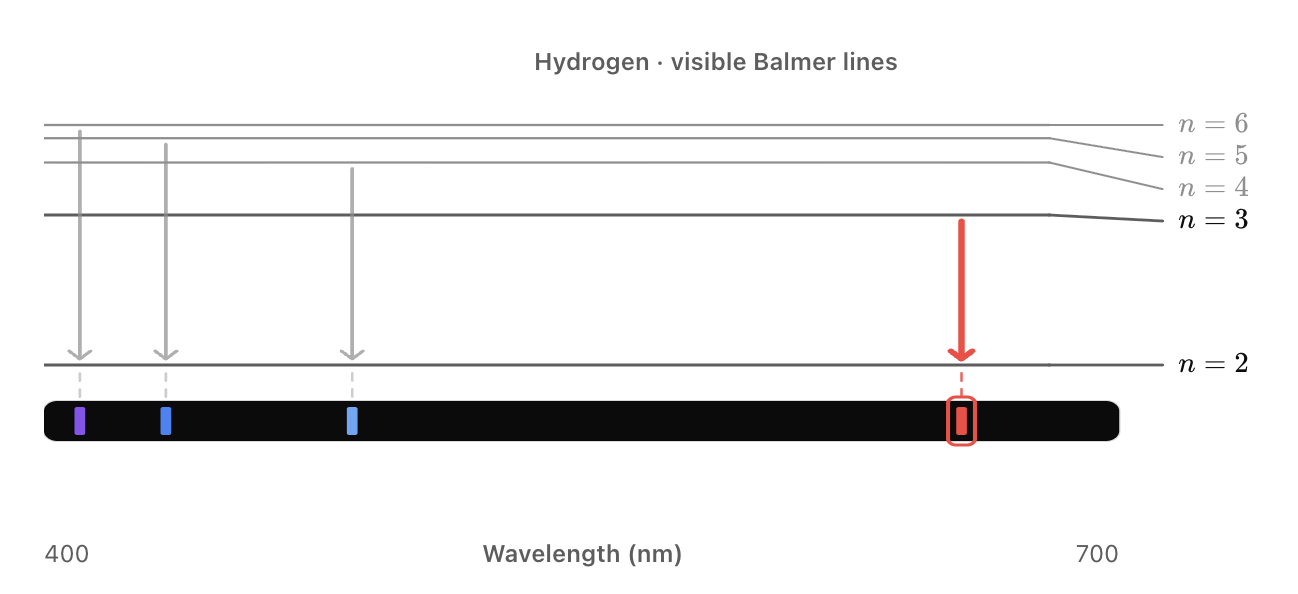
The most familiar visible hydrogen lines belong to the Balmer series.
The Balmer Series

The visible Balmer lines are produced when electrons fall from higher energy levels to:

n = 2

Important transitions include:

n = 3 → n = 2

n = 4 → n = 2

n = 5 → n = 2

n = 6 → n = 2

These produce characteristic wavelengths in the visible part of the electromagnetic spectrum.

The strongest familiar Balmer lines occur at approximately:

Transition Wavelength Approximate Appearance
n = 3 → 2 656 nm Red
n = 4 → 2 486 nm Blue-green
n = 5 → 2 434 nm Blue-violet
n = 6 → 2 410 nm Violet

These values are often used when studying hydrogen spectra.

https://images.openai.com/static-rsc-4/EqJYcDJvUF2Ju-2s4N7ERUZig5WrSHaD-8RBZ5fEgHiQnoStAISLkScuc9QPSa6u6vOXHId3dBe3mEPbxJTGsQ9GhGggQqX870RrVw7fXOfvJMTrWeyLVWveBVdMuZ4bXuF65yz4H4xunr_Tu_PYTUgpFnIyWrJqUC8-FjVfnfQpXN3uYUDKdTXSVO6gcdxs?purpose=fullsize
 
https://images.openai.com/static-rsc-4/NQiGVhq_unrQ28tg-NrCqjhG81-FNQh2L7QEZhf3hvnB1PGk0yCjeo2Auavt1BOjyvOCdReDBbz-_acw_vq4ZWN1uXC47gxeoYsxVP8FM3XGNAJYNUesJPwr_EndCFlZGLIU0UbJvDsZrQU2prVxAb70v0iHZbPUZD4QAnhNrXQBW90UuXfCh5g2jFb3UZP0?purpose=fullsize
 
https://images.openai.com/static-rsc-4/-6GjBtPRSP7iWTIvkv3xtxjne_eoRmN0SMc9of52IIZ1-BNx2TCeW-EB_0fJO5O77Lpu6k4qLidb3yLzkaURq1EBIjK7yPfdvM_I94kJYOo9dgh-GyZa0HF0kSYTcqkmxarC9e3i9aKe3bjepUQF2ahIoUN3Ln6zpiwBkKy6oyGtl_EhUbw8QIHawwGSpWFb?purpose=fullsize
 
4

The Red Hydrogen Line

One of the most recognizable lines in the hydrogen spectrum is the red line at approximately:

656 nm

It is produced by the transition:

n = 3 → n = 2

This line is commonly called H-alpha.

Because this transition has a particular energy difference, it always produces the same characteristic photon wavelength under ordinary conditions.

H-alpha is especially important in astronomy and is widely used to study hydrogen-rich regions of space.


Other Hydrogen Spectral Series

The Balmer series is only one part of hydrogen's spectrum.

Different groups of transitions produce different spectral series.

Lyman Series

Electrons fall to:

n = 1

These transitions mainly produce ultraviolet radiation.

Balmer Series

Electrons fall to:

n = 2

Several of these transitions produce visible light.

Paschen Series

Electrons fall to:

n = 3

These transitions mainly produce infrared radiation.

There are additional hydrogen series at still longer wavelengths.

https://images.openai.com/static-rsc-4/baTkijCRFU6nHBm6-luiObKQAHYRdUaNetGzq-bNrWS85hz0MpyiIgZ6aPMe4ikOZVYLgsI11ceVu-PyKlsmBDHLHBk8bNMjFdq00SWgmbo2jitq7YUswPmZYzX7RinFwx3skbWUYctlq4RfjA6b_4tIeaY-UBwjDRzV2vJn3jcq_8mJiMGm1HIvSvi7IKVn?purpose=fullsize
 
https://images.openai.com/static-rsc-4/GE53nBGNtslW2xL4dU3pFanZ7xCvm1FSEXaDa1uIM8JPCYUehPsbjT3Y5IK2f5o4dsj57AK1J-A_ifS2cnuhjZa6cKkO7KK8XcT8xZFPUDG1peNNqTi7mEb9RzMjZ-Vw9V4D4lbpWtyBBwc3ulvOvAoZEshGLsNerUh8XBGwFfLt_skBbx6rJ5O490Zl1gfS?purpose=fullsize
 
https://images.openai.com/static-rsc-4/Dvf4yPyKz50DYfrg8VrL1W8aarbzMjP2Rc2Hei0G3wu-FuOrLgaXqNiR-ZMFHoIyIlIciVsLgCifzcdnxWXJseDMvpUjaxdyn8HfVZJvjsW9NVxQ95xE2b-yZzTQbfrRxOm_AVvi3OTr7ZqGxeDpkBU_BX1roTX9aIReQ0zoprgiwT9YwohSp_jMI7Hk6KaP?purpose=fullsize
 
4

Why Some Hydrogen Lines Are Invisible

Human eyes detect only a small portion of the electromagnetic spectrum.

Visible wavelengths are approximately:

380 nm to 750 nm

Hydrogen emits photons outside this range as well.

Transitions producing ultraviolet or infrared radiation cannot be seen directly by the human eye, but they can be detected using scientific instruments.

Therefore, an emission spectrum is not limited to visible light.

It can include electromagnetic radiation across many regions of the spectrum.


The Hydrogen Energy Levels

The allowed energy levels of hydrogen become progressively closer together as n increases.

The lowest level is:

n = 1

This is the ground state.

Higher values such as:

n = 2

n = 3

n = 4

represent excited states.

As n increases, the levels become closer together and approach the ionization limit.

https://images.openai.com/static-rsc-4/fdAKtzkPp9jlgh5Ls6qw20MU5fGz9OtR8H--tv2LTBPI7m6-28KNue7TkS-3vL1lgCbRKZGVAkb1LwG0mFFHLsTCRzxf0dz0fSdptKtb7mHIH6D95RpzM1A80dozheyhiE0deKBi-oOiEG9FG0K7WaeRAPm9fHCQ6IYxnTic7sW0OxBMrsyarswoXv8Xfx1Y?purpose=fullsize
 
https://images.openai.com/static-rsc-4/KEuRSjgtPTqYQ1dCR37kmb94bfx3h3MzOIOb9CIPNFRid4Hb-YiTW3IWOF0bOhmRrm2mmccd-PxYkb-T97uDfL0_xvh-k9lc6UIUJmypGmlZdtUNnJD61C-WM9Jv4SmER1nxnlZS8zSq7RvF-k78pgCsAa7ivgyln_J-HLXcYSP7x-EPFa36duh__s_TfUQX?purpose=fullsize
 
https://images.openai.com/static-rsc-4/0fIvZ2UAOjA_p6Tx212pQxNAqJsLmTf4q2fIJy27IC6syC7GuLCGyUDXMTH-AoX1OFpJF4EmwMvpSRur7UZbBAEoJ2skQ_b21MGGebAEtguTE5cVY1lAuNnUBd0kynT_JKuYzvNH6aSPub7XR0uCNfieDyAa1pAihZbHKn5BvlSSfCBg2k3EQeRiAwlxxYdj?purpose=fullsize
 
4

Worked Example: Finding the Energy Difference

Suppose an electron falls from:

E₃ = −1.51 eV

to:

E₂ = −3.40 eV

The magnitude of the energy released is:

E_photon = |−3.40 − (−1.51)|

E_photon = 1.89 eV

That energy is released as a photon.

This particular transition in hydrogen corresponds to the red H-alpha line at approximately 656 nm.


Worked Example: Comparing Two Spectral Lines

Suppose:

Transition A releases 3.0 eV.

Transition B releases 2.0 eV.

Transition A releases more energy.

Therefore, Transition A produces:

  • a higher-energy photon
  • a higher frequency
  • a shorter wavelength

Transition B produces:

  • a lower-energy photon
  • a lower frequency
  • a longer wavelength

Notice that higher energy does not mean longer wavelength.

It means the opposite.


Why Different Elements Have Different Spectra

Every element has its own atomic structure.

Different atoms have:

  • different numbers of protons
  • different numbers of electrons
  • different electron configurations
  • different interactions between electrons and the nucleus
  • different allowed energy states

Therefore, the energy gaps between electron states differ from element to element.

Different energy gaps produce different photon energies.

Different photon energies produce different wavelengths.

Therefore:

each element has a characteristic emission spectrum.

https://images.openai.com/static-rsc-4/RwaJfpWgYTOdAHmCCKmsjHgbna7fLeYwRiYUA7ULWKF2WsraHz2xn_SmlMSGRLw8yyW08itg93Bv-qZzatf1_ohw1_EcYFpdKoBNNwtuAIxhj77IeEPM-EHSvxgOTRV8WD_XhqnxQ2CL2IS6klVM7u8Xt191wzXae_LFGtw-5MQX4UlSlpDNnQctSp9wJjDR?purpose=fullsize
 
https://images.openai.com/static-rsc-4/YjV5v5GbVLfqPe98ziBKVOoZ7WG9cLUWtfZSxOMURRdWNcUoqH5UM4M3QsAREpAm7a3UKzAGCeSYs9ffQ3GQ2qiAJy2pUvlr49SD-OBpwOH14aXujKIP8f7T4GrSz6yjsSEgbrkD090B8-rug7abDEo6wk0hdRBiEcXYkykgi7Qo88wfwHknA_9mN71Iz_yN?purpose=fullsize
 
https://images.openai.com/static-rsc-4/at0ceBH2zp1I6tDcLqXXinKrGg7f7ISQAIJ1MCQkG_MoTGPNLyiau7GCTosS7DG1LAuJzkOWTyX-1thKdrOqlO-2jNPmAjm6IbtUyVDO0qqw5rMd8-ixhbvBhfszCLnYAzh1u9q_uIQiBhXpw88IYxx3NxYyppQo9hC6rvwn2rbfCc_hBZEQby32VJ43YunF?purpose=fullsize
 
6

Spectra as Atomic Fingerprints

Because each element produces a characteristic pattern of spectral lines, its spectrum can be used like a fingerprint.

Suppose an unknown gas produces bright lines at several wavelengths.

Scientists can compare those wavelengths with known laboratory spectra.

If the lines match the characteristic spectrum of helium, helium is likely present.

If another group matches hydrogen, hydrogen is likely present too.

A mixture can therefore contain spectral lines from several elements.


Identifying an Unknown Element

Suppose an unknown sample produces lines at:

447 nm

501 nm

588 nm

668 nm

Scientists do not simply look at one line.

Instead, they compare the pattern of lines with reference spectra.

The pattern includes:

  • the wavelengths present
  • their relative positions
  • sometimes their relative intensities

A strong match between the observed pattern and a known element provides evidence that the element is present.


Why One Line Is Usually Not Enough

Different elements can sometimes have spectral lines at similar wavelengths.

Therefore, identifying an element using only one line can be unreliable.

A stronger identification uses multiple matching lines.

For example, if an unknown sample has five prominent lines and all five match the known spectrum of an element, the evidence is much stronger than matching only one line.

This is similar to comparing several features of a fingerprint rather than only one.


Flame Tests and Emission Spectra

A simple example of atomic emission occurs in a flame test.

When certain metal ions are heated in a flame, electrons gain energy.

As electrons return to lower energy states, photons are emitted.

Different substances can produce characteristic flame colours.

Examples commonly observed include:

  • sodium — strong yellow
  • potassium — lilac
  • lithium — crimson red
  • calcium — orange-red
  • copper compounds — blue-green

The colour seen by eye is only a simplified observation of the much more detailed emission spectrum.

https://images.openai.com/static-rsc-4/vvNWUktdhDDeCA0pZ1Td4_Cc0k4_107NSSp76zSKDKy1f4VNu3DOdiX9Lr_3QEf_jCWbUfr_55RdTfiFoWNtbMl-Pe-8yWjEzlmhsyvH-R5R18_idJBw2OCinyLfueazh9tlrZsIBtm9CzS2sLLmzn1qjg5vePFhGe20AC05nBbUfiZ35F9uSaA6Fb6-DLV6?purpose=fullsize
 
https://images.openai.com/static-rsc-4/MdZDcrFhnKYQQy7qvspZ2ahkQrDjDM6wbN1LW8mSHLKTnYNDadjrRYCMHOJsf4J94ZqoQMJ9kRdTZJ7DXBLf-9pFU-crQ8k6KFjqdR4CYKYK08jQ_2I0Dg8tLCdtTCBqBJwbKexmkdmHCyMFQyyi3Y536AP6aVUmIol2Y9omMq8cKmJbK7lVcYJTB2jTKnUV?purpose=fullsize
 
https://images.openai.com/static-rsc-4/ry1M2XOHGWn6lhXT0lZ1M7i3p8J-VzF0S8KH85suBzXSIcaEz9sDr_w70Xk7O8MDlHjUTqxGiitS7rU4SDdAH9nMMFGe8CGUSQXwKz5x8IdZZ2XyAGDJs6Y3cHq6OIGoLLrDqmTpuf5YkJUOqcsQDGS39YJXQmZXuVzYiJdhPcx1VKWDGu90k5jJ6OmNlYCa?purpose=fullsize
 
5

Why Spectroscopy Is Better Than Simply Looking at Colour

Two substances can produce colours that appear similar to the human eye.

A spectroscope separates the light into individual wavelengths.

This reveals much more information.

Instead of simply observing:

"the flame looks yellow"

scientists can determine:

which exact wavelengths are present.

This makes spectral analysis much more precise than visual colour identification alone.


The Spectroscope

A spectroscope is an instrument used to separate light into its component wavelengths.

A simple spectroscope may use:

  • a narrow slit
  • a diffraction grating or prism
  • a viewing system or detector

The light enters through the slit and is separated according to wavelength.

For an excited atomic gas, separate bright lines become visible.

Modern instruments usually use electronic detectors to measure the wavelengths and intensities very accurately.

https://images.openai.com/static-rsc-4/X3S1bEgZZHqpnROGyNF8Y9yd_uDAaTP9qiozxNlZ8g3PRDvEQ_kW-KRgCpg64ejLQnagpiGnxyZQjXbweiW5zpgDkWsuW-3_zW8ol4j1LxF79ZFstm2z6QvNqrw0FXi045HvWEtzrrAxjBXTYrMoEVZ219OrCxOg6FJaxui2tmPaOJgAGV1k1bahYmygz-BU?purpose=fullsize
 
https://images.openai.com/static-rsc-4/Z5fE9ffud0Qzp6q2SJ2kdKc5h5qOFfGsicgxd6Gw7im9DTX9UwOrZajnbANuEwXtjAmH_wLo-zoru2FXk7gK042mdYFW91RtDZ6jI1jmHQODe7HTPCF4X-sPcuKgCOzRR4J3yVeU0FqrvUASqXWQhwGz7a3B8F0VXqFLSbo_x7_Jj-aMou6fp8IIxOMzWl5Z?purpose=fullsize
 
https://images.openai.com/static-rsc-4/VbBgLbw92NAezhna2VSuihxg4UhUNO29N4cfGjrjhk4COatcfJih4HhVCk0FmsMrm8KasaaKJe88gzLtR7ywimxZS7uLGAGr9Xai775k5Z1zngQfcAkNewOORFC3aecr4jebbRdCFqcqgQJtm9XUdM1UV1eGqvciZwlpI8tK5M-aimkfT8hEVsWWNlsW8NRF?purpose=fullsize
 
6

Diffraction Gratings

A diffraction grating contains a very large number of closely spaced lines or grooves.

Different wavelengths of light diffract at different angles.

This separates the emitted light into its component wavelengths.

As a result, a mixture of wavelengths that initially travels together can be observed as separate spectral lines.


Gas Discharge Tubes

A common classroom demonstration uses a gas discharge tube.

The tube contains a low-pressure gas such as:

  • hydrogen
  • helium
  • neon
  • mercury vapour

An electrical potential difference is applied.

The electrical energy excites atoms in the gas.

As their electrons return to lower energy states, photons are emitted.

Looking at the light through a spectroscope reveals the characteristic line spectrum of the gas.


Neon Signs

Neon lighting provides a familiar application of atomic emission.

Electrical energy excites atoms in the gas.

The atoms then emit characteristic wavelengths as their electrons return to lower-energy states.

Pure neon is particularly associated with a reddish-orange glow.

Other gases or coatings can be used to produce other colours.

The underlying process is still based on electronic excitation and emission.


Emission Spectra in Astronomy

Spectroscopy is one of the most powerful tools in astronomy.

Astronomers cannot normally collect samples directly from:

  • stars
  • nebulae
  • distant galaxies

Instead, they analyse the light reaching Earth.

Spectral lines can reveal which elements are present.

Hydrogen, helium, sodium, calcium, iron and many other elements have been identified in astronomical objects using their characteristic spectra.

https://images.openai.com/static-rsc-4/XqCtd1sCAjq9Tz61k0RueanJNxHaajW4yC-cyohBLEsbzCShAB0mN9RdGVWa85daHBEvArzbjU34Uv6W5AvDmSKDAbEzK-dPUUqvvjge6m6EkV8ZhhfTe98fAt2oXKSfWBIHMKAFR6heruCrdvKKff2CdrWNPjApaj2ysPDRoDG7A5M6hXvgzbbLI_H5Rl-g?purpose=fullsize
 
https://images.openai.com/static-rsc-4/7jbzr3j6vV6vuHKRqEARl5OyXtUrL2EoTJsvEUjvEz0YjstPRymXFpJIu9zNF3K8I3j13YcGrGzOku2QpAh7ip60OytkQc2c64eWhjeNiKel2BRb_nqqfHG8h8axbrWfZj-rRNJq68ggsC-awkDyt3YWd_0jtqTZQo8RlCBFZVdZ9FPPRytY4s3dKeDDrkRF?purpose=fullsize
 
https://images.openai.com/static-rsc-4/N7QJeDS2P-MmgZl4Gd1O-d0G1slWJwQ0D73GyrBtlnlsE0ARjQmfP8jzYuC-1NRKa5ylZ-CZLRUwdtm1l9VNTTd81GHYjcwvYRyK43foNKITgWL2vEO3Pcy7mwMvVvj-FFkTF4Jir0ZD0T6ObaOqQNFikCRkqheC7rp0xg4Wyn--aHylwPlwHsjJeGQZrheH?purpose=fullsize
 
6

Hydrogen in Space

Hydrogen is the most abundant element in the universe.

Its spectral lines are therefore extremely important in astronomy.

The red H-alpha line is especially useful for observing regions containing excited hydrogen.

Many glowing nebulae contain large amounts of hydrogen gas.

When hydrogen atoms are excited and then release energy, strong H-alpha emission can be produced.

This helps astronomers study regions where stars are forming.


More Than Identifying Elements

Spectra can provide information beyond chemical composition.

Depending on the situation, scientists can use spectral information to investigate:

  • temperature
  • density
  • motion
  • chemical composition
  • magnetic fields
  • conditions inside plasmas
  • properties of stars and galaxies

Changes in the positions of spectral lines can also provide information about motion through the Doppler effect.

The key point is that spectral lines provide a highly precise way of studying matter remotely.


Emission and Absorption Spectra

Emission and absorption spectra are closely related.

Emission Spectrum

Produced when excited atoms release photons.

Appears as:

bright lines against a dark background

Absorption Spectrum

Produced when atoms absorb particular wavelengths from a continuous source.

Appears as:

dark lines within a continuous spectrum

The characteristic wavelengths correspond to energy differences between allowed atomic states.

https://images.openai.com/static-rsc-4/ug4MY7drpMuVpn_cLefo4wxR-jizLJCAYtCSZXn_pHDO54hetM3W0-Qg6eCHvjhYmfUv2WSrSrlgG-oO3T84aZm61_zqRR9gsfVGHKguCRaOETGL9SJfv2V86CvQ9PzrLePxm5SCGRX6UezyWswnxp0rHk2r5jSnPU6uLAqDBp6lHO-gROqWWXtD1UCN-kqw?purpose=fullsize
 
https://images.openai.com/static-rsc-4/VgDpKnx2lTgyK_zjUSXa-2OtdT94UijRVIpUDuGi5Yc3--1xdf8_YG0tRJkWXgwo6k7jzxtL6PwzJLtdR9Zj39QxHL4HRjenNNyNYcP-ThJmkhMXdonfs8Pg31dZQ2awoFEPsJGmrCdFdYmx_Da_0YeaU2_gyeZZFPqApC2q4JKu0vFmwoeLY5gwrPqcQJbp?purpose=fullsize
 
https://images.openai.com/static-rsc-4/LfXmz_31oB4ke2FO7nn04DiY8RzS3l3HbXgt7jSyxEZRmm9SzL4IEeOAWwBFQIXL6x-i6d3QQQ21ePyyvUNXKhpPIE-pSDYVwvMN2pOvL7qUAx8DwcHTpxqojrniA0cUi1Tc_FQSBcFO8GPiiEgFpFlvxvFfQANopYUNICzgnZM5hrzSDFC54LB2ypitj72_?purpose=fullsize
 
6

Why Emission and Absorption Lines Are Related

Suppose an atom can absorb a photon that moves an electron:

E₁ → E₂

The required photon has energy:

ΔE = E₂ − E₁

The reverse transition:

E₂ → E₁

can emit a photon with that same energy difference.

Therefore, the wavelengths associated with absorption and emission are connected to the same atomic energy-level structure.


From Energy Levels to a Spectrum

The entire process can be summarized:

Atoms receive energy

↓

Electrons move to excited states

↓

Electrons return to lower states

↓

Specific energy differences are released

↓

Photons with specific energies are emitted

↓

Specific frequencies and wavelengths are produced

↓

A spectroscope separates the wavelengths

↓

Bright spectral lines appear

↓

The pattern can identify the element

This is the central connection between quantum physics and spectroscopy.


Example: Identifying Elements in a Mixture

Suppose reference spectra show:

Element A: lines at 410, 434, 486 and 656 nm

Element B: lines at 447, 502, 588 and 668 nm

An unknown mixture contains strong lines near:

410, 434, 447, 486, 502, 588, 656 and 668 nm.

The unknown spectrum contains the characteristic lines of both reference patterns.

Therefore, there is evidence that:

Element A and Element B are both present.

In real spectroscopy, scientists may consider line intensity, measurement uncertainty and additional spectral lines before making a final identification.


Worked Example: Calculating Photon Frequency

Suppose a spectral line has wavelength:

λ = 656 nm

Convert to metres:

656 nm = 6.56 × 10⁻⁷ m

Use:

c = fλ

Rearrange:

f = c/λ

Substitute:

f = (3.00 × 10⁸)/(6.56 × 10⁻⁷)

f ≈ 4.57 × 10¹⁴ Hz

This is the approximate frequency of the red H-alpha photon.


Worked Example: Photon Energy

Using:

f = 4.57 × 10¹⁴ Hz

and:

h = 6.63 × 10⁻³⁴ J·s

Use:

E = hf

E = (6.63 × 10⁻³⁴)(4.57 × 10¹⁴)

E ≈ 3.03 × 10⁻¹⁹ J

Therefore, each photon associated with this spectral line carries approximately:

3.03 × 10⁻¹⁹ J

of energy.


Common Mistakes

Thinking a line spectrum is a continuous rainbow

A line spectrum contains only particular wavelengths separated by dark regions.

Thinking spectral lines come from electrons moving around the nucleus continuously

The lines result from transitions between specific allowed energy states.

Thinking electrons emit light while moving upward

Moving upward generally requires absorption of energy.

Light is emitted when an electron moves to a lower-energy state.

Thinking every transition produces visible light

Many transitions produce ultraviolet or infrared radiation.

Thinking all elements have the same spectrum

Each element has its own characteristic energy-level structure and therefore its own characteristic spectral pattern.

Identifying an element from only one weak line

A pattern of several matching lines provides much stronger evidence.

Thinking colour alone is the same as a spectrum

A visible colour is much less detailed than a wavelength-resolved spectrum.

Confusing emission and absorption spectra

Emission spectra contain bright lines from emitted radiation.

Absorption spectra contain missing wavelengths within a continuous spectrum.

Assuming higher energy means longer wavelength

Higher photon energy corresponds to shorter wavelength.

Forgetting That Spectra Extend Beyond Visible Light

Emission spectra can contain ultraviolet, infrared and other wavelengths that humans cannot see.

Thinking the Dark Gaps Mean "No Energy"

The gaps mean those particular wavelengths are not strongly emitted in the observed atomic transitions. They do not mean the atom contains no energy.


Key Terms

Emission spectrum — The pattern of electromagnetic radiation emitted by a substance.

Line spectrum — A spectrum consisting of separate discrete wavelengths.

Spectral line — A particular wavelength appearing in a spectrum.

Continuous spectrum — A spectrum containing an essentially continuous range of wavelengths.

Quantized energy level — One of the specific allowed energies of an electron in an atom.

Ground state — The lowest allowed energy state.

Excited state — An allowed state above the ground state.

Excitation — The process of giving an atom energy so an electron moves to a higher state.

Transition — A change between allowed electron energy states.

Photon — A discrete packet of electromagnetic energy.

Emission — The release of electromagnetic radiation.

Frequency — The number of wave cycles passing a point each second.

Wavelength — The distance between corresponding points on successive waves.

Planck's constant — The constant h relating photon energy to frequency.

Hydrogen spectrum — The characteristic collection of wavelengths emitted or absorbed by hydrogen atoms.

Balmer series — Hydrogen spectral lines produced by transitions ending at n = 2.

Lyman series — Hydrogen spectral lines produced by transitions ending at n = 1.

Paschen series — Hydrogen spectral lines produced by transitions ending at n = 3.

H-alpha — The prominent hydrogen spectral line near 656 nm produced by the n = 3 → 2 transition.

Spectroscope — An instrument used to separate light into its component wavelengths.

Spectrometer — An instrument that measures properties of a spectrum, usually with greater quantitative precision.

Spectroscopy — The study and measurement of interactions between matter and electromagnetic radiation.

Diffraction grating — A structure containing many closely spaced lines or grooves that separates light according to wavelength.

Gas discharge tube — A low-pressure gas tube in which electrical energy excites atoms and produces characteristic emission.

Atomic fingerprint — An informal description of the characteristic spectral pattern that can be used to identify an element.

Flame test — A qualitative test in which substances are heated and identified partly by characteristic emitted colours.

Electron volt (eV) — A unit of energy commonly used for atomic-scale energies.

Absorption spectrum — A spectrum containing wavelengths removed when atoms absorb particular photon energies.


Key Takeaways

  • Excited atoms can produce emission spectra.
  • Energy supplied to an atom can move electrons into excited states.
  • Excited electrons can return to lower energy states.
  • Downward electron transitions release energy as photons.
  • The photon energy equals the energy difference between the states.
  • Photon energy and frequency are related by:

E = hf

  • Frequency and wavelength are related by:

c = fλ

  • Larger energy gaps produce higher-energy photons.
  • Higher-energy photons have higher frequencies.
  • Higher-frequency photons have shorter wavelengths.
  • Atomic electron energies are quantized.
  • Because only particular energy levels exist, only particular photon energies are produced.
  • This produces a line spectrum rather than a continuous spectrum.
  • Each bright spectral line corresponds to a particular photon wavelength.
  • Each photon wavelength corresponds to an allowed atomic energy transition.
  • Hydrogen produces a characteristic line spectrum.
  • The visible hydrogen lines mainly belong to the Balmer series.
  • Balmer transitions end at n = 2.
  • The H-alpha line occurs near 656 nm and corresponds to n = 3 → 2.
  • Hydrogen also produces ultraviolet and infrared spectral lines.
  • Different elements have different atomic energy structures.
  • Different elements therefore produce different patterns of spectral lines.
  • An element's spectrum can act like an atomic fingerprint.
  • Scientists identify elements by comparing unknown spectra with known reference spectra.
  • Several matching spectral lines provide stronger evidence than one matching line.
  • Spectroscopy can identify elements in laboratory samples and distant astronomical objects.
  • Emission spectra provide strong experimental evidence for quantized atomic energy levels.

The central idea is:

Unique energy levels → unique energy gaps → unique photon wavelengths → unique emission spectrum


Check Your Understanding

1. What is an emission spectrum?

2. Describe how an atom becomes excited.

3. What happens when an excited electron moves to a lower energy state?

4. Why is a photon emitted during a downward electron transition?

5. What determines the energy of the emitted photon?

6. State the relationship between photon energy and frequency.

7. State the relationship between frequency and wavelength.

8. What happens to wavelength as photon energy increases?

9. What is a line emission spectrum?

10. Why does an atomic line spectrum contain separate lines rather than a continuous range of colours?

11. Explain how line spectra provide evidence for quantized energy levels.

12. Describe the appearance of a typical atomic emission spectrum.

13. Why are dark spaces present between the bright spectral lines?

14. Why is hydrogen particularly useful when introducing atomic emission spectra?

15. What is the Balmer series?

16. To which energy level do Balmer-series transitions end?

17. Which hydrogen transition produces the H-alpha line?

18. Approximately what wavelength is H-alpha?

19. Why are some hydrogen spectral lines invisible to humans?

20. What regions of the electromagnetic spectrum contain the Lyman and Paschen series?

21. Explain why different elements have different emission spectra.

22. Why can an emission spectrum be described as an atomic fingerprint?

23. Why is matching several spectral lines more reliable than matching only one?

24. Describe how a spectroscope helps scientists analyse emitted light.

25. Explain how flame tests are related to atomic emission spectra.

26. What is the difference between an emission spectrum and an absorption spectrum?

27. Explain how astronomers can determine which elements are present in distant astronomical objects.

28. A photon has a wavelength of 500 nm. Calculate its frequency using:

c = 3.00 × 10⁸ m/s

29. Use your answer to Question 28 to calculate the photon energy using:

h = 6.63 × 10⁻³⁴ J·s

30. Challenge: An unknown gas produces bright spectral lines at approximately:

410 nm, 434 nm, 486 nm and 656 nm.

a. Compare these wavelengths with the visible Balmer lines of hydrogen.
b. Identify the likely element.
c. Explain why matching several lines gives stronger evidence than matching only one.
d. Which of the four wavelengths corresponds to the highest-energy photon?
e. Which has the lowest frequency?
f. Which has the shortest wavelength?
g. Which has the longest wavelength?
h. Identify the hydrogen transition responsible for the 656 nm line.
i. Explain what happens to an electron during this transition.
j. Explain why the electron releases a photon.
k. Explain why the photon has a specific wavelength rather than any wavelength.
l. Explain how this observation supports the idea of quantized atomic energy levels.
m. Describe how the same principle could be used to identify another element in a mixture.
n. Explain one way emission spectroscopy is useful outside the classroom.